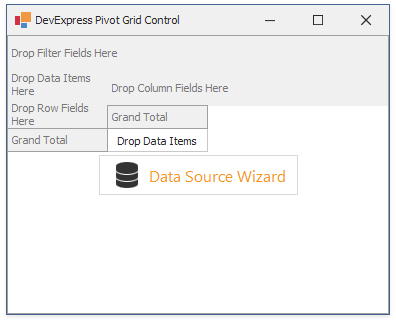
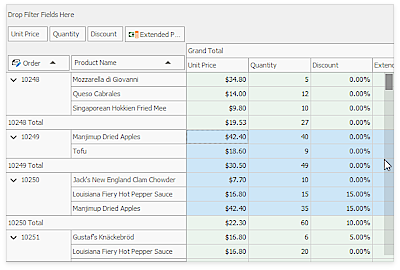
The DevExpress WinForms PivotGridControl allows you to create a pivot table for multi-dimensional data analysis. The Pivot Grid summarizes large amounts of data in a cross-tabular format that can be sorted, grouped and filtered. End-users can customize the pivot table layout by simple drag-and-drop operations. The Pivot Grid supports drill-down (to view the underlying data for calculated cells), printing and exporting to various file formats (such as PDF, XLS and XLSX).
| If you are a first-time user, you can refer to the following tutorials and videos:
|
| Topics in this section describe how you can provide data for the PivotGridControl.
- Binding to Data Overview topic provides general information on binding to databases, XML files, lists of data created at runtime, etc.
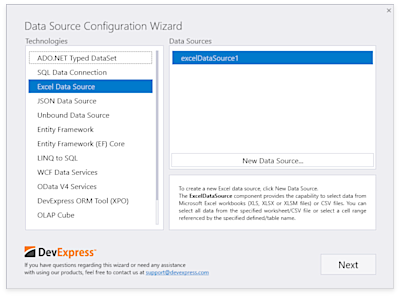
- Data Source Configuration Wizard describes the capability to establish a connection to various types of data sources such as ADO.NET DataSets, SQL databases, OLAP cubes, etc.
- OLAP Data Source topic describes how to connect to a Microsoft Analysis Services server (OLAP server), lists supported Analysis Services versions, and provides information on Pivot Grid Control functionality limitations imposed when bound to an OLAP server.
- Database Server Mode topic describes how to connect a pivot grid control to a database with a large number of records without performance loss.
- Unbound Fields topic describes the capability to create fields that are not bound to any data source fields, and populate them with data manually.
- Optimized Mode and Data Binding API topic introduces a new API to specify the field’s source data and calculations, available in Optimized mode.
- Local Data Stores topic describes how to save Pivot Grid Control data to a file or stream in order to work with it when the original data source becomes unavailable.
- Asynchronous Mode describes the capability to perform data-aware operations (retrieving data from the server, sorting, grouping, filtering data and calculating summaries) in a background thread.
|
| This section contain topics that describe data-related features provided by the Pivot Grid control. These include data filtering, value formatting, sorting and grouping data, using summaries, etc..
- Summarization provides the capability to process underlying data and display the results of the calculations.
- Grouping allows you to group field values into categories (ranges) automatically.
- Sorting is used to re-arrange the records to meet current sort settings. Here you will learn how to limit the number of displayed values, sort data by summary or change a sort order.
- Editing describes how to customize data cells to support data editing.
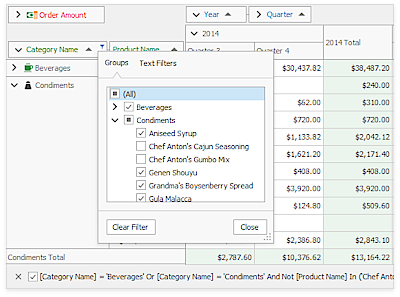
- Filtering provides information about different data filtering ways, from simple approaches to complex filter criteria with multiple conditions.
|
| This section illustrates the powerful features that help to organize, analyze and interpret Pivot Grid’s data.
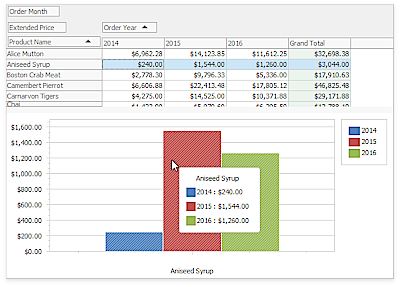
- Integration with the Chart Control describes how to visualize data displayed in the pivot grid using the Chart Control. Set a Pivot Grid control as the Chart control data source and display your data as bars, areas, lines and many other forms. Here you will learn how to customize a Chart control to display Pivot Grid data.
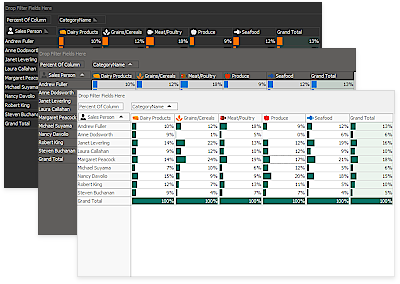
- Conditional Formatting introduces a Microsoft Excel-inspired conditional formatting feature that allows you to change the appearance of individual cells based on specific conditions. This feature helps to highlight important information, identify trends and exceptions, and compare data using the collection of format rules. Here you will learn how to change appearances of Pivot Grid Control cells depending upon cell data or an expression.
- Key Performance Indicators topic describes how to evaluate business success with the help of KPI, that is a collection of calculations associating with a measure group in a cube. Here you will learn how to work with Key Performance Indicators provided by OLAP cubes.
|
| The topics in this section describe the ways in which you can manage the PivotGridControl layout (changing the layout of fields and data cells, grouping fields, etc.).
- Field Groups describes the capability of arranging fields into groups.
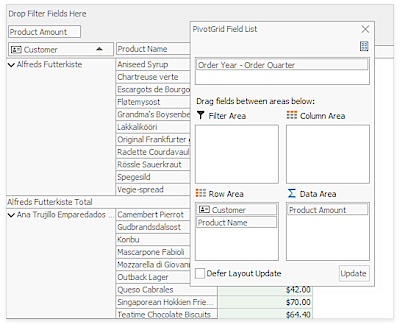
- Customization Form introduces a Customization Form designed to make layout customization easier for end-users.
- Best Fit describes how to automatically adjust the column width to display its entire content.
- Save and Restore Layout describes how to save and restore a Pivot Grid Control layout, allowing you to customize a Pivot Grid Control just once and then apply the saved settings to other pivot grids in other applications.
|
| Topics in this section provide information on moving focus between cells, scrolling through Pivot Grid Control contents and selecting data cells in code.
|
| This section contains articles that explain how to export and/or print data displayed within your Pivot Grid.
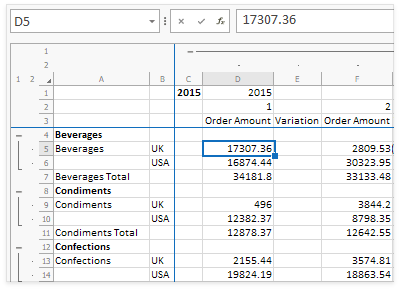
- Exporting topic describes how to export Pivot Grid data to a file or stream in various formats - HTML, MHT, PDF, RTF, DOCX, TXT, CSV, XLS or XLSX.
- Printing describes how to print Pivot Grid data using the Print Preview window.
|
| A PivotGridControl appearance can be customized in a number of ways. You can customize appearance settings used to paint its visual elements (buttons, field headers, cells, etc.), provide a consistent look and feel, or paint the control manually. Topics in this section provide you with all the necessary information.
- Appearances topic provides general information on how to customize appearances of Pivot Grid Control elements.
- Custom Draw topic shows how to customize Pivot Grid Control element appearances by painting them manually.
- Look and Feel describes the Look and Feel feature that allows you to provide a common appearance for all controls in your application.
- PivotGridControl Elements Painted via Appearances lists Pivot Grid Control visual elements whose appearances can be customized to define how the elements are displayed or printed.
|
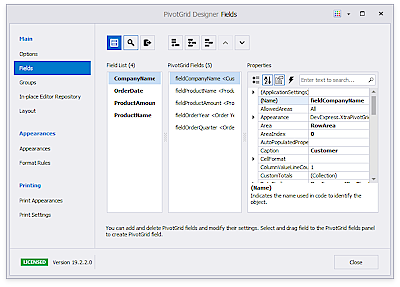
| This section describes the ways in which you can customize the Pivot Grid control at design time. The PivotGrid Designer allows you to customize fields, the layout of reports, appearance settings and printing options. It is also possible to customize the Pivot Grid Control fields and their layout directly on the form, without invoking the designer.
|
Miscellaneous
To get more information about a Pivot Grid control, see the following sections.
|
See Also