Series
- 7 minutes to read
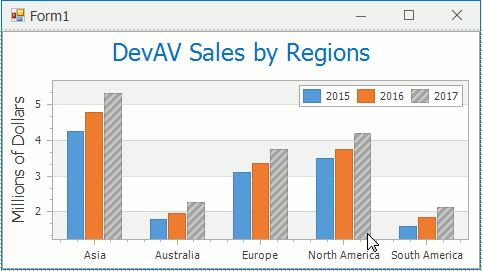
The Series is the chart element that represents data within the Chart Control. The series’s view specifies the data’s appearance. The Series’s elements (Series Labels, Series Titles and others) display additional information about series’ data. For example, The Series Titles show series names and allow end-users to identify the pie series within the Chart Control. The Series also provides a filtering and sorting functionality to filter and sort data before visualization.

This topic consists of the following sections:
- Series Creation
- Individual Series Accessing
- Data Providing
- Series View Changing
- Series Elements Customization
Series Creation
Use one of the following approaches to add a series to the chart:
-
The following code adds a manually created series with no data to the chart:
// The series has a constructor that specifies which view // the series uses. Series series = new Series("2015", ViewType.Bar); chartControl.Series.Add(series);Next, fill a series with data using one of the ways described in the Data Providing section.
The code above uses the below classes and members:
Symbol Description Series Represents an individual series within a chart control. ChartControl.Series Provides access to the chart control’s collection of series objects. Refer to the Create a Series Manually topic to learn how to add a series at design time.
Create series from a data source
In this approach, the chart generates series from its data source:
class GdpItem { public int Year { get; set; } public String Country { get; set; } public double Value { get; set; } } // ... List<GdpItem> gdpInfo = GetGdpInfo(); chartControl.DataSource = gdpInfo; // The Year property's unique values determine series. chartControl.SeriesTemplate.SeriesDataMember = "Year"; // These properties define data members that // the chart uses to create series points. chartControl.SeriesTemplate.ArgumentDataMember = "Country"; chartControl.SeriesTemplate.ValueDataMembers.AddRange("Value");The previous code snippet contains the following classes and members:
Symbol Description ChartControl.DataSource Gets or sets the chart control’s data source. ChartControl.SeriesTemplate Returns the series template the chart uses to generate its series. SeriesTemplate.SeriesDataMember Gets or sets the name of the data member whose values identify series. Refer to the Data Providing: Getting data from a data source section for more information about argument and value data members. See the Generate Series from a Data Source document for more information about series templates.
Individual Series Accessing
Each chart can contain an unlimited number of series. You can click on a series to access it at design time .
Use the following code to get access to an individual series at runtime:
// The series collection provides two ways to get an item:
// By index;
Series indexedSeries = chartControl.Series[0];
// By series name (the Name property value);
Series indexedSeries = chartControl.Series["Series name"];
The following table lists the properties used the code above:
| Symbol | Description |
|---|---|
| ChartControl.Series | Provides access to the chart control’s collection of series objects. |
| SeriesCollection.Item | Provides access to individual items that the collection stores. |
| Series.Name | Gets or sets the name of the series. |
Data Providing
The series obtains the data it visualizes in the following ways:
Manually adding points to a series
In this approach, the series point objects that the series stores represent the argument-value set that a series should visualize. The following code demonstrates how to populate a series with series points:
Series y2015Series = chartControl.Series["2015"]; y2015Series.Points.Points.AddRange( new SeriesPoint("Asia", 4.2372), new SeriesPoint("Australia", 1.7871), new SeriesPoint("Europe", 3.0884), new SeriesPoint("North America", 3.4855), new SeriesPoint("South America", 1.6027));The code above uses the following classes and properties:
Symbol Description Series.Points Gets the series’ collection of data points. SeriesPoint Represents an individual series point. Note that series points can be created at design time. The series’s Points collection provides helper methods that simplify adding points with several values at runtime. Refer to the Manually Add Points to a Series topic to learn more about these features.
Getting data from a data source
This means that the series’s data source provides its data row field values to the series as argument and values. The SeriesBase.ArgumentDataMember and SeriesBase.ValueDataMembers properties specify which data source values should be used. The code below demonstrates how to use this approach:
class StockItem { public Date Date { get; set; } public double Open { get; set; } public double High { get; set; } public double Low { get; set; } public double Close { get; set; } } // ... List<StockItem> googleStockInfo = GetGoogleStockInfo(); Series googleStockSeries = chartControl.Series["Google"]; googleStockSeries.DataSource = googleStockInfo; // Specify DataMembers directly: googleStockSeries.ArgumentDataMember = "Date"; googleStockSeries.ValueDataMembers.AddRange("Close"); // Or configure them using one of Set...DataMembers methods. googleStockSeries.SetDataMembers("Date", "Close");The previous code uses the following classes and members:
Symbol Description Series.DataSource Gets or sets the series’ data source. SeriesBase.ArgumentDataMember Gets or sets the name of the data field that contains series point arguments. SeriesBase.ValueDataMembers Gets a collection of the names of data fields that contain series point values. SeriesBase.SetDataMembers Specifies the data members whose values the series uses to populate series points’ arguments and values. Important
The series may provide points that represent data source values. These points are generated on the first series points getting. Due to performance reasons, it is strongly recommended not to request series points when the series is data bound.
Refer to the Specify Series Data Members section for more information about design-time customization and helper methods.
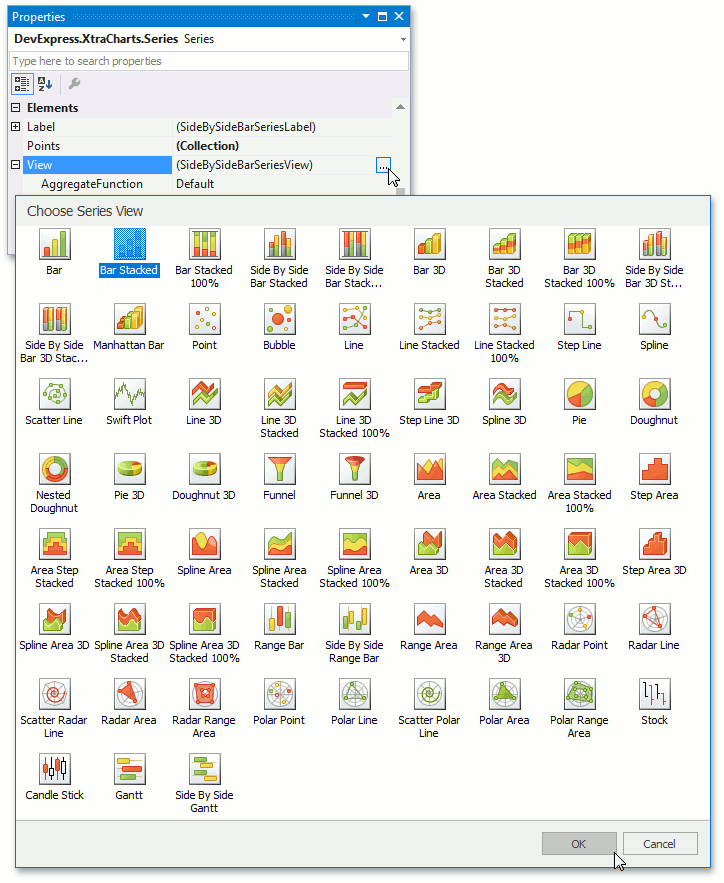
Series View Changing
To change the series view at design time, select the series, locate the SeriesBase.View property in the Properties window and click the ellipsis button. In the invoked dialog window, select the series view and click OK.
Use the below code to change the series view at runtime:
The code above uses the following classes and properties:
| Symbol | Description |
|---|---|
| SeriesBase.View | Gets or sets the view that the series uses to visualize its data. |
| SeriesViewBase | Represents the base class for all series view objects. |
Important
Series that the chart displays should have compatible series views. For example, the pie series view is not compatible with the area series view, and a chart cannot show these series simultaneously. In this case, the chart draws the first series in the collection.
Series Elements Customization
The following series elements that display additional information about series’ data are customizable:
Element and Description | Sample Image |
|---|---|
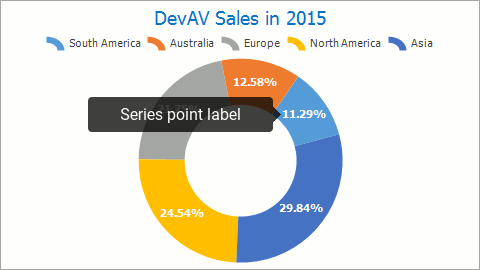
|
Text labels that represent point’s values, for example arguments or values in percent. |
|
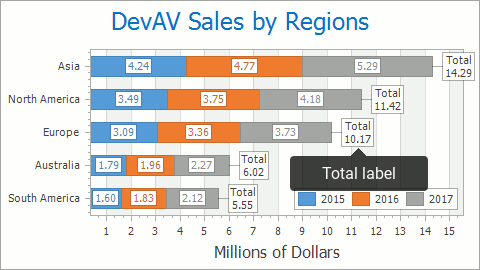
|
Total Labels show Stacked Bar series groups’ summary values or all pie points’ summary value. |
|
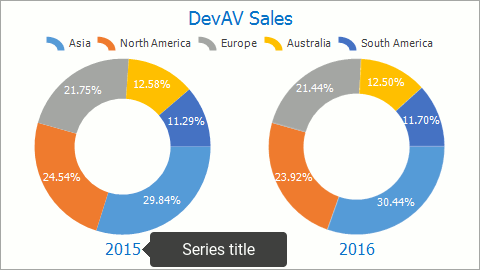
|
The Series Title accompanies a series and usually displays the series name. The Series Titles are designed to allow end-users to distinguish several series that the chart displays simultaneously and are available only for series that use the Pie, Doughnut or Funnel series view. |
|
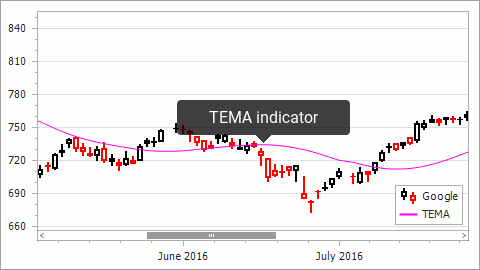
|
Indicators allow you to perform visual data analysis using the 2D XY-series data’s. |
|