Percentage Modes
- 3 minutes to read
Percentage summary display modes are used to display percentages of Total and Grand Total values in data cells.
The following percentage modes are available.
PivotSummaryDisplayType.PercentOfColumn
The percentage of the Column Total value is displayed in the cell.
In the following image, the SummaryDisplayType properties of the two data fields are set to Default and PercentOfColumn respectively.
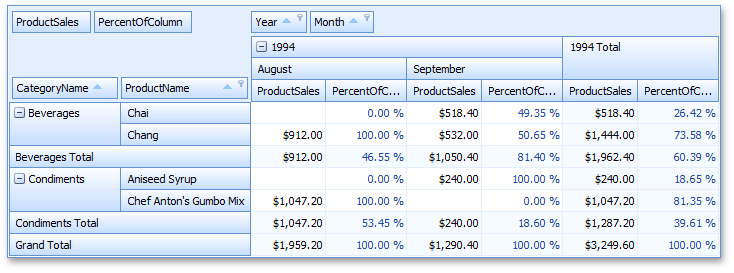
Cell values are calculated as follows.
“Chai - September - PercentOfColumn”
0.4935 = 518.4/1050.4
518.4 is the actual sum calculated against the Product Sales field for the “Chai - September” cell, and 1050.4 is the Total value calculated for this column (“Beverages - September”).
“Beverages Total - September - PercentOfColumn”
0.814 = 1050.4/1290.4
1050.4 is the Total value calculated for the “Beverages - September” column against the Product Sales field, and 1290.4 is the Grand Total value calculated for this column (“September”).
PivotSummaryDisplayType.PercentOfColumnGrandTotal
The percentage of the Column Grand Total value is displayed in the cell.
In the following image, the SummaryDisplayType properties of the two data fields are set to Default and PercentOfColumnGrandTotal respectively.
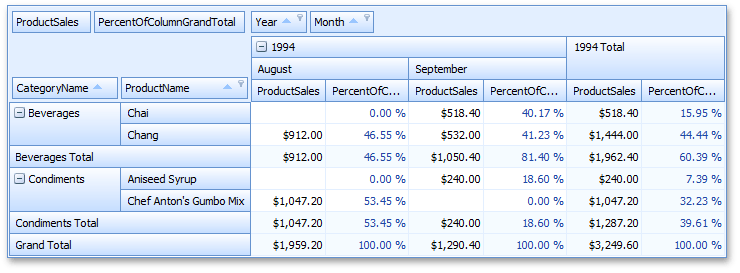
For instance, the “Chai - September - PercentOfColumnGrandTotal” cell value is calculated as follows: 0.4017 = 518.4/1290.4, where 518.4 - is the actual sum calculated against the Product Sales field for the “Chai - September” cell, and 1290.4 is the Grand Total value calculated for this column (“September”).
PivotSummaryDisplayType.PercentOfRow
The percentage of the Row Total value is displayed in the cell.
In the following image, the SummaryDisplayType properties of the two data fields are set to Default and PercentOfRow respectively.
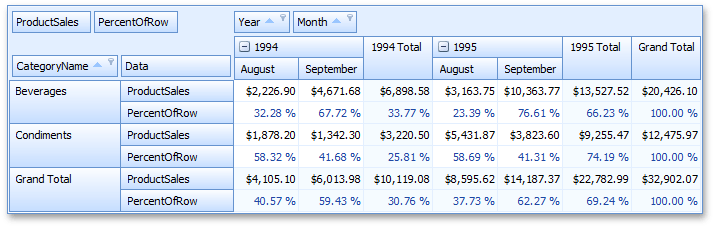
Cell values are calculated as follows.
“Beverages - August 1994 - PercentOfRow”
0.3228 = 2226.9/6898.58
2226.9 is the actual sum calculated against the Product Sales field for the “Beverages - August 1994” cell, and 6898.58 is the Total value calculated for this row (“Beverages - 1994 Total”).
“Beverages - 1994 Total - PercentOfRow”
0.3377 = 6898.58/20426.1
6898.58 is the Total value calculated for the “Beverages - 1994” row against the Product Sales field, and 20426.1 is the Grand Total value calculated for this row (“Beverages”).
PivotSummaryDisplayType.PercentOfRowGrandTotal
The percentage of the Row Grand Total value is displayed in the cell.
In the following image, the SummaryDisplayType properties of the two data fields are set to Default and PercentOfRowGrandTotal respectively.
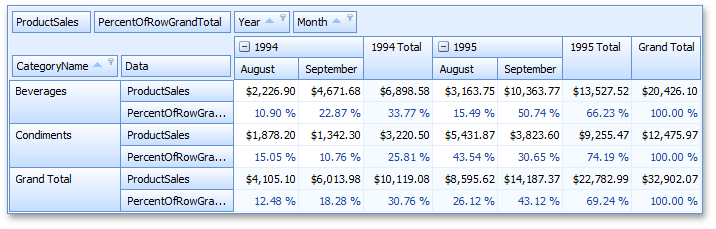
For instance, the “Beverages - August 1994 - PercentOfRowGrandTotal” cell value is calculated as follows: 0.109 = 2226.9/20426.1, where 2226.9 - is the actual sum calculated against the Product Sales field for the “Beverages - August 1994” cell, and 20426.1 is the Grand Total value calculated for this row (“Beverages”).
PivotSummaryDisplayType.PercentOfGrandTotal
The percentage of the Grand Total value is displayed in the cell.
In the following image, the SummaryDisplayType properties of the two data fields are set to Default and PercentOfGrandTotal respectively.

For instance, the “Chai - September - PercentOfGrandTotal” cell value is calculated as follows: 0.1595 = 518.4/3249.6, where 518.4 - is the actual sum calculated against the Product Sales field for the “Chai - September” cell, and 3249.6 is the Grand Total value calculated against all data cells.
Note
In percentage summary display modes, values are automatically formatted as percentages. To specify custom formatting settings, use the data field’s PivotGridFieldBase.CellFormat property.