Variation Modes
- 2 minutes to read
Variation summary display modes are used to display absolute and percent variances between the current value and the previously calculated value for the current field.
The following variation modes are available.
PivotSummaryDisplayType.AbsoluteVariation
The absolute variance between the current value and the previously calculated value for the current field is displayed in the cell.
In the following image, two data fields are bound to the same field (“Order Count”). Their SummaryType properties are set to Sum, but the SummaryDisplayType properties are set to Default and AbsoluteVariation respectively.
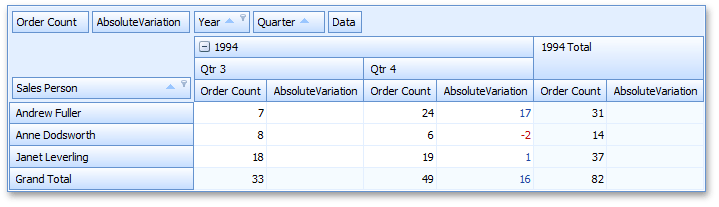
For instance, the “Andrew Fuller - Quarter 4 - AbsoluteVariation” cell value is calculated as follows: 17 = 24 - 7, where 24 - is the actual sum calculated against the Order Count field for “Andrew Fuller - Quarter 4”, and 7 is the previous summary value (“Andrew Fuller - Quarter 3”).
PivotSummaryDisplayType.PercentVariation
The percentage variance between the current value and the previously calculated value for the current field is displayed in the cell.
In the following image, the SummaryDisplayType properties of the two data fields are set to Default and PercentVariation respectively.
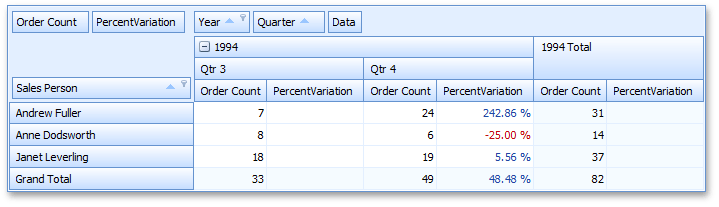
For instance, the “Andrew Fuller - Quarter 4 - PercentVariation” cell value is calculated as follows: 2.4286 = (24-7)/7. In this mode, values are automatically formatted as percentages, so the cell displays “242.86%” instead of “2.4286”. To specify formatting settings, use the data field’s PivotGridFieldBase.CellFormat property.
You can hide the first (empty) column/row that displays variation data for the current data field. For this, set the PivotGridFieldOptions.HideEmptyVariationItems property to true.