LineSeries2D.ShowIsolatedPoints Property
Gets or sets the value that defines whether to show series points between empty points (whose values are undefined).
Namespace: DevExpress.Xpf.Charts
Assembly: DevExpress.Xpf.Charts.v20.1.dll
NuGet Packages: DevExpress.WindowsDesktop.Wpf.Charts, DevExpress.Wpf.Charts
Declaration
Property Value
| Type | Description |
|---|---|
| Boolean | true, if the Chart Control shows isolated points; otherwise, false |
Remarks
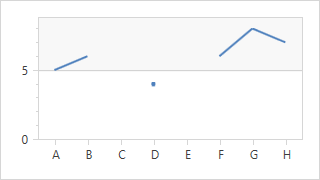
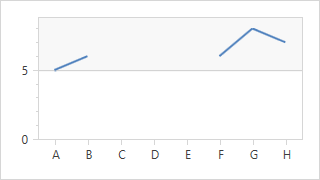
The following images demonstrate how the ShowIsolatedPoints property operates:
| ShowIsolatedPoints = true | ShowIsolatedPoints = false |
|---|---|
 |
 |
<dxc:ChartControl>
    <dxc:XYDiagram2D>
        <dxc:LineSeries2D ShowIsolatedPoints="True">
            <dxc:SeriesPoint Argument="A" Value="5"/>
            <dxc:SeriesPoint Argument="B" Value="6"/>
            <dxc:SeriesPoint Argument="C" />
            <dxc:SeriesPoint Argument="D" Value="4"/> <!-- This point is isolated. -->
            <dxc:SeriesPoint Argument="E" />
            <dxc:SeriesPoint Argument="F" Value="6"/>
            <dxc:SeriesPoint Argument="G" Value="8"/>
            <dxc:SeriesPoint Argument="H" Value="7"/>
        </dxc:LineSeries2D>
    </dxc:XYDiagram2D>
</dxc:ChartControl>
See Also