CountIntervalNumericScaleOptions Class
The options that provide means to configure a specified number of axis intervals.
Namespace: DevExpress.Xpf.Charts
Assembly: DevExpress.Xpf.Charts.v20.1.dll
NuGet Packages: DevExpress.WindowsDesktop.Wpf.Charts, DevExpress.Wpf.Charts
Declaration
Remarks
The AxisX2D.NumericScaleOptions property allows you to assign the CountIntervalNumericScaleOptions object to the axis.
Use the Count property to specify the number of axis intervals. The interval width is automatically calculated.
To create a histogram with bins of specified width, use the WidthIntervalNumericScaleOptions class.
Example
This example demonstrates how to create a histogram chart with a given number of bins.
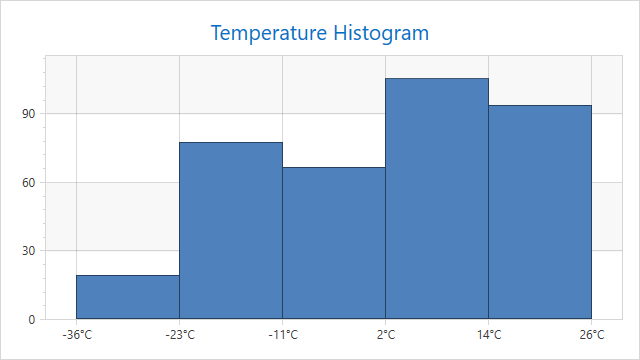
The code below configures a histogram for a chart with a numeric x-axis scale.
<dxc:ChartControl x:Name="chartControl">
    <dxc:XYDiagram2D>
        <dxc:XYDiagram2D.AxisX>
            <dxc:AxisX2D TickmarksMinorVisible="False"
                         GridLinesVisible="True">
                <dxc:AxisX2D.NumericScaleOptions>
                    <!-- Configure a histogram chart with the specified number of bins. -->
                    <dxc:CountIntervalNumericScaleOptions AggregateFunction="Histogram"
                                                          Count="5"
                                                          GridLayoutMode="GridAndLabelShifted"/>
                    <!--...-->
                </dxc:AxisX2D.NumericScaleOptions>
                <dxc:AxisX2D.Label>
                    <dxc:AxisLabel TextPattern="{}{A:F0}°C"/>
                </dxc:AxisX2D.Label>
                <dxc:AxisX2D.WholeRange>
                    <dxc:Range SideMarginsValue="0.8"/>
                </dxc:AxisX2D.WholeRange>
            </dxc:AxisX2D>
        </dxc:XYDiagram2D.AxisX>
        <dxc:BarSideBySideSeries2D  DisplayName="Temperature"
                                    DataSource="{Binding}"
                                    ArgumentDataMember="Temperature"
                                    BarWidth="1">
        </dxc:BarSideBySideSeries2D>
    </dxc:XYDiagram2D>
</dxc:ChartControl>
The following API members configure the histogram options:
| Member | Description |
|---|---|
CountIntervalNumericScaleOptions |
The options that provide means to configure a specified number of axis intervals. |
| ManualNumericScaleOptions.AggregateFunction | Gets or sets the function that is used to aggregate numeric axis data when one of the AxisX2D.NumericScaleOptions, AxisX3D.NumericScaleOptions, or CircularAxisX2D.NumericScaleOptions properties is set to ManualNumericScaleOptions. |
| CountIntervalNumericScaleOptions.Count | Gets or sets the number of intervals. |
| IntervalNumericScaleOptions.GridLayoutMode | Gets or sets the value that specifies the alignment of grid lines, major tickmarks and axis labels. |