VCL Charts: Line View Tutorial. Step 2. Bind Series to Data
- 3 minutes to read
The previous step explained how to add a Chart control, apply a skin to the application, and create empty line series at design time. This step describes how to populate a memory-based dataset, configure a data source, and bind created series to dataset fields.
Add a Dataset and Populate It
Add a TdxMemData component to the form. This component is a memory-based dataset that you can link to a data-aware control or a Chart control series in bound data access mode.
Change the component’s name to mdPopulation.
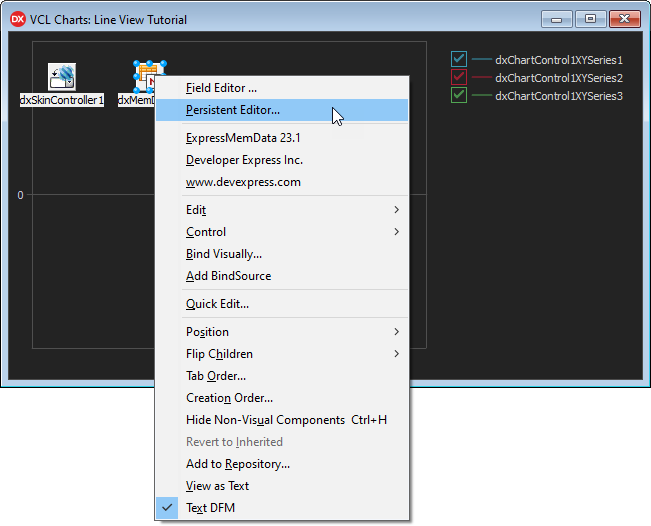
Right-click the component and select Persistent Editor… in the context menu to invoke the dialog that allows you to manage dataset fields and records.
Follow the steps below to populate the dataset:
- Click Get Fields to load dataset fields from a file. Locate the Population.dat file installed with DevExpress Demos. The default installation path is C:\Users\Public\Documents\DevExpress\VCL\Demos\ExpressCharts\Data\.
- Click Load… to populate dataset fields with data. Select the same file in the opened dialog.
Note
You need to install demos to use demo datasets.
The following image demonstrates the populated memory-based dataset:
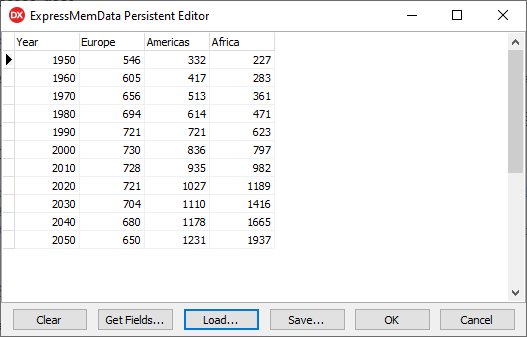
Click OK to apply changes and close the Persistent Editor.
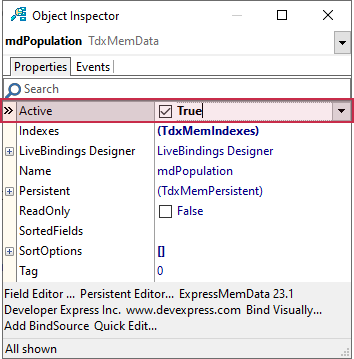
Set the TdxMemData component’s Active property to True to allow a bound control to interact with stored data.
Bind Series to a Data Source
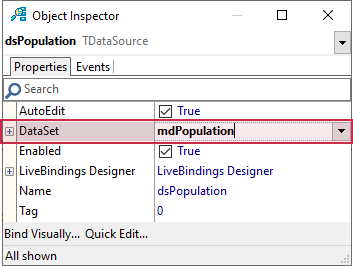
Add a TDataSource component that allows you to bind a dataset to a Chart series. Rename the component dsPopulation.
Configure the Data Source
Set the component’s DataSet property to mdPopulation to link the data source component to the previously populated memory-based dataset.
Bind a Series to the Data Source
Double-click the Chart control to invoke the Chart Designer dialog.
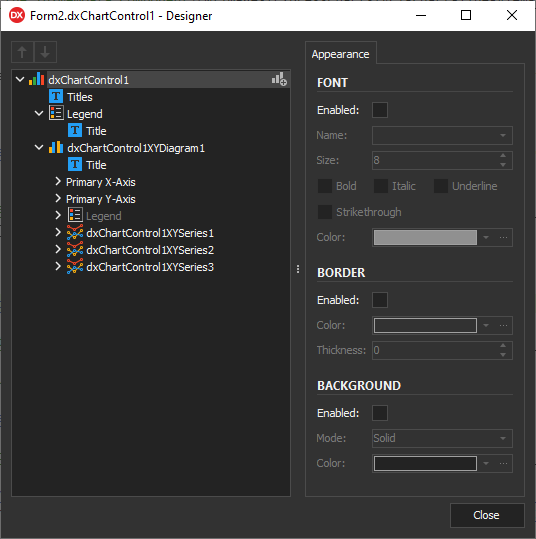
Select dxChartControl1XYSeries1 and rename it to PopulationEurope.
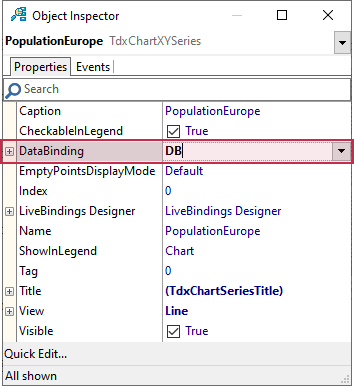
Set the DataBinding property to DB.
Expand the DataBinding node in the Object Inspector and assign the dsPopulation data source to the DataSource property.
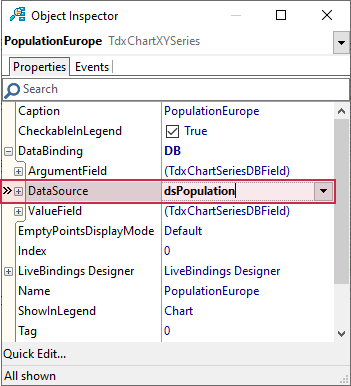
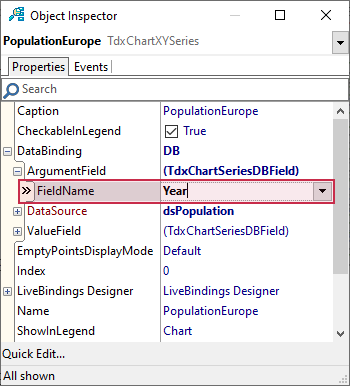
Expand the ArgumentField node and set the FieldName property to Year.
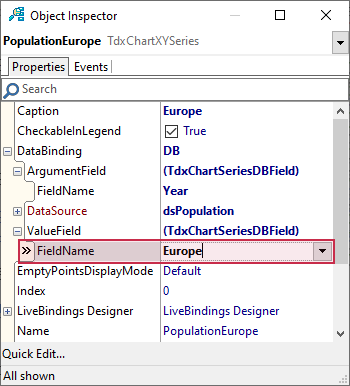
Expand the ValueField node and set the FieldName property to Europe.
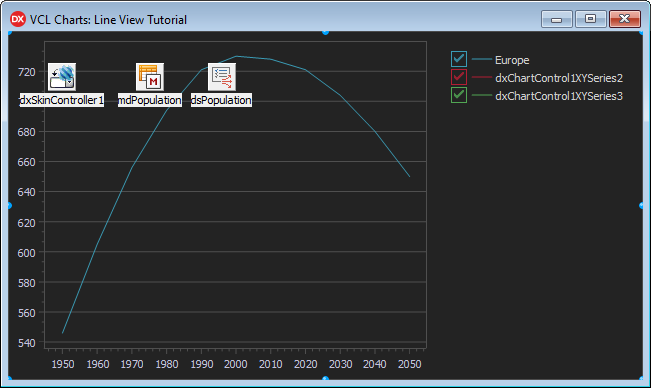
As a result, the Chart control displays the PopulationEurope series. Note that the chart legend automatically displays the corresponding dataset field name as a series caption.
Bind Remaining Series to Data
Bind the remaining two series to data in the same manner as PopulationEurope:
- Rename dxChartControl1XYSeries2 to PopulationAmericas.
- Rename dxChartControl1XYSeries3 to PopulationAfrica.
- Set the DataBinding property of PopulationAmericas to
DB. - Assign the dsPopulation data source component to the DataBinding.DataSource property.
- Set the DataBinding.ArgumentField.FieldName property to
Year. - Set the DataBinding.ValueField.FieldName property to
Americas. - Repeat steps 3-5 for the PopulationAfrica series.
- Set the DataBinding.ValueField.FieldName property of the PopulationAfrica series to
Africa.
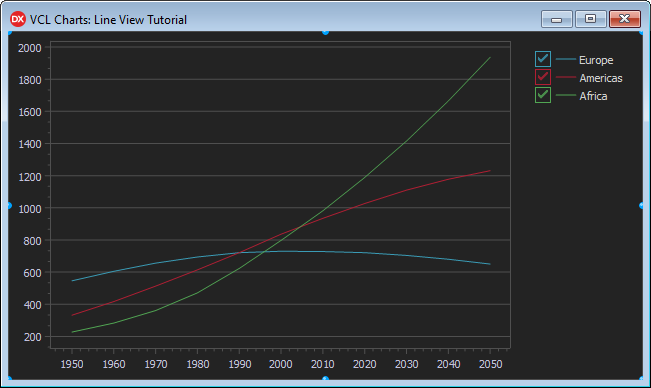
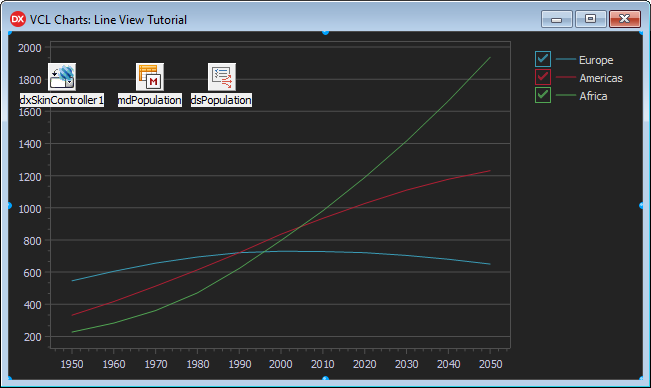
The Chart control displays three line series as a result.
Note
You can press Ctrl+H to hide non-visual components that can overlap form content at design time.
Result
The Chart control displays three line series with the default appearance settings. The chart legend displays the corresponding dataset field names.
Next Step
The next step describes how to add and configure optional visual chart elements and customize series appearance.