TdxChartSeriesDBDataBinding.ValueField Property
Provides access to data binding settings for series values in bound mode.
Declaration
property ValueField: TdxChartSeriesDBField read; write;Property Value
| Type | Description |
|---|---|
| TdxChartSeriesDBField | The settings of the dataset field used as a source of series values in bound mode. |
Remarks
To obtain series values from a dataset, do the following:
- Use the DataSource property to bind a series to data.
- Make sure that the underlying dataset is enabled.
- Assign the name of a field in the underlying dataset to the ValueField.FieldName property.
Refer to the TdxChartSeriesDBField class description for information on all available options.
Example
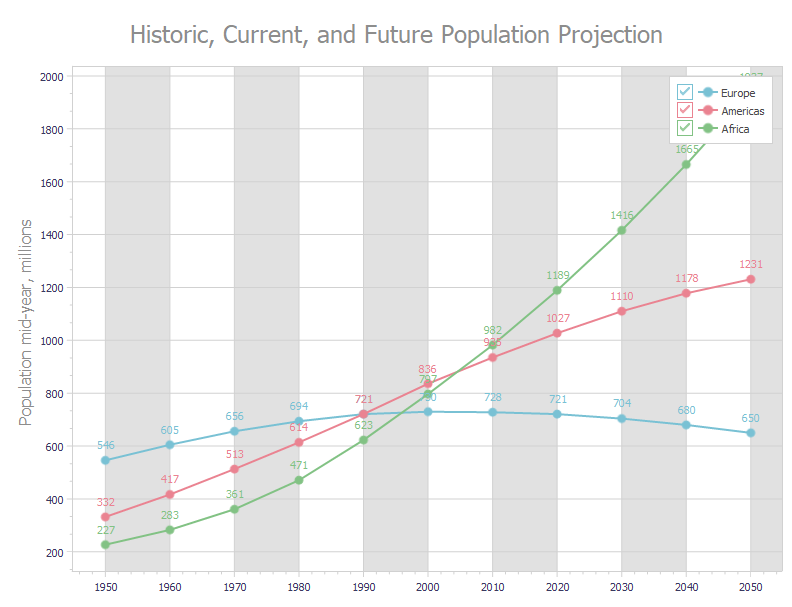
The following code example creates three line series with identical appearance settings in bound mode:
var
  AXYDiagram: TdxChartXYDiagram;
  AXYSeriesAmericas, AXYSeriesEurope, AXYSeriesAfrica: TdxChartXYSeries;
  ALineView: TdxChartXYSeriesLineView;
  ADataBinding: TdxChartXYSeriesDBDataBinding;
begin
  dxChartControl1.BeginUpdate;  // Initiates the following batch change
  try
    dxChartControl1.Titles.Add.Text := 'Historic, Current, and Future Population Projection';
    AXYDiagram := dxChartControl1.AddDiagram<TdxChartXYDiagram>;
    AXYDiagram.Axes.AxisY.Title.Text := 'Population mid-year, millions';
    AXYDiagram.Axes.AxisX.Interlaced := True;
    AXYSeriesEurope := AXYDiagram.AddSeries('Europe');  // Creates a new series with the caption "Europe"
    AXYSeriesEurope.ShowInLegend := TdxChartSeriesShowInLegend.Diagram;
    ADataBinding := AXYSeriesEurope.DataBinding as TdxChartXYSeriesDBDataBinding;
    ADataBinding.DataSource := dsPopulation;  // Assigns a data source
    ADataBinding.DataSource.DataSet := mdPopulation;  // Assigns a dataset
    ADataBinding.DataSource.DataSet.Active := True;  // Enables the assigned dataset
    ADataBinding.ArgumentField.FieldName := 'Year';  // Specifies the source dataset field for arguments
    ADataBinding.ValueField.FieldName := 'Europe';  // Specifies the source dataset field for values
    AXYSeriesEurope.ViewType := 'Line';  // Selects the Line series View
    ALineView := TdxChartXYSeriesLineView(AXYSeriesEurope.View);
    ALineView.Markers.Visible := True;  // Displays value markers
    ALineView.ValueLabels.Visible := True;  // Displays value labels
    ALineView.Appearance.StrokeOptions.Width := 2;  // Increases line width
    AXYSeriesAmericas := AXYDiagram.AddSeries;  // Creates a new series with the default settings
    AXYSeriesAmericas.AssignFrom(AXYSeriesEurope);  // Copies all settings from the "Europe" series
    AXYSeriesAmericas.Caption := 'Americas';  // Defines a different series caption
    // Specifies a different source dataset field for values
    TdxChartXYSeriesDBDataBinding(AXYSeriesAmericas).ValueField.FieldName := 'Americas';
    AXYSeriesAfrica := AXYDiagram.AddSeries;  // Creates a new series with the default settings
    AXYSeriesAfrica.AssignFrom(AXYSeriesEurope);  // Copies all settings from the "Europe" series
    AXYSeriesAfrica.Caption := 'Africa';  // Defines a different series caption
    // Specifies a different source dataset field for values
    TdxChartXYSeriesDBDataBinding(AXYSeriesAfrica).ValueField.FieldName := 'Africa';
  finally
    dxChartControl1.EndUpdate;  // Calls EndUpdate regardless of the batch operation's success
  end;
end;
See Also