VCL Charts: Line View Tutorial. Step 1. Create Line Series
- 3 minutes to read
This step describes how to add a VCL Chart control, create XY line series, and apply a skin to the project at design time.
Add a Chart Control to the Form
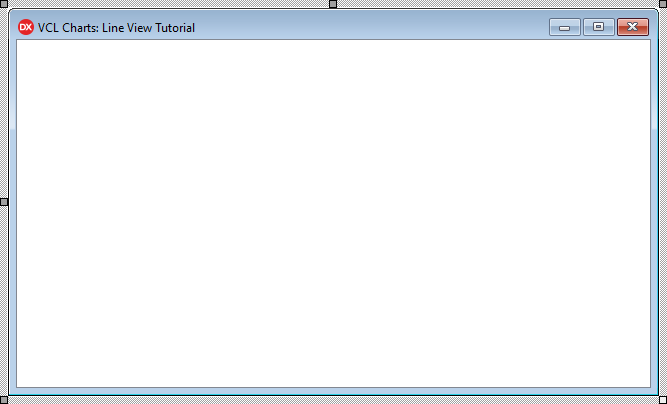
Drag a VCL Chart control (TdxChartControl) from the Tool Palette onto the form. Set the control’s Align property to alClient in the Object Inspector to allow the control to occupy the form’s client area.
Add and Configure a Skin Controller
The Skin Controller allows you to select a theme (a skin) for your application. The selected theme applies consistent look & feel across all DevExpress controls as well as standard forms.
Review Project Settings Related to DevExpress Skins
Make sure that support for DevExpress skins is enabled for the application project. Click the Project group in the main menu of your RAD Studio® IDE and select Modify Skin Options to invoke the Project Skin Options Editor.
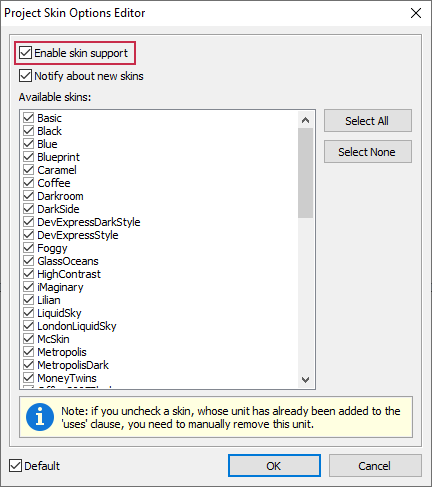
Check Enable skin support if it is unchecked and click OK to close the Project Skin Options Editor dialog.
Add a Skin Controller to the Form
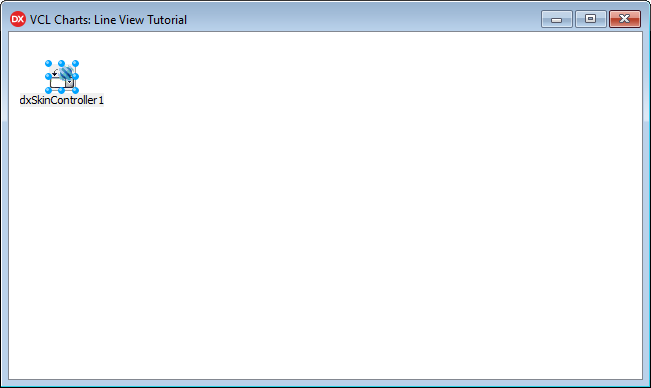
Drag a TdxSkinController component from the Tool Palette onto the form.
Apply a Skin
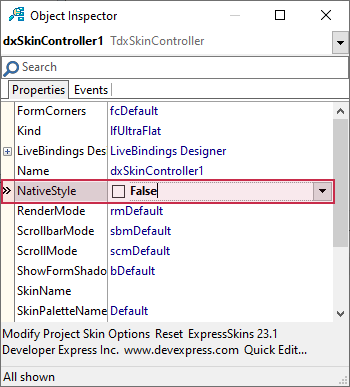
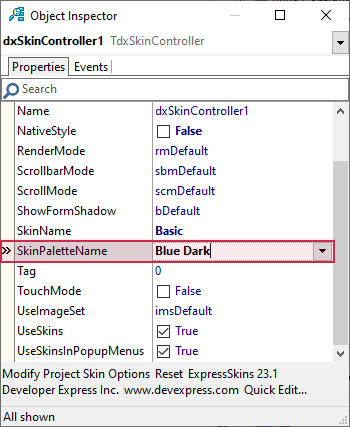
Make sure that the Skin Controller is selected. Set the NativeStyle property to False in the Object Inspector because the native (operating system-dependent) look & feel style has priority over skins and built-in basic styles.
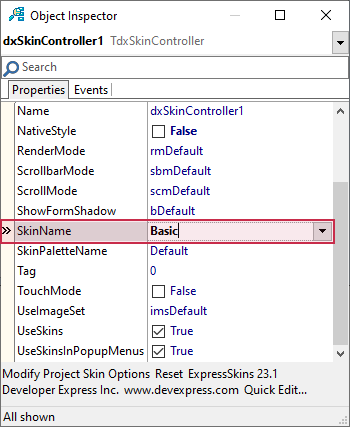
Select a skin in the SkinName combo box in the Object Inspector.
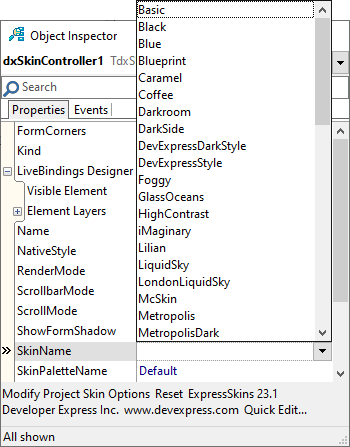
For example, you can select the vector skin named Basic.
Vector skins are recommended for high-resolution environments because vector skin elements are SVG images that DevExpress controls can render at any target monitor DPI without quality losses.
Select a Color Scheme
Each vector skin ships with a set of dark and light color schemes (color palettes). You can use the SkinPaletteName property to switch between color schemes available for the currently selected vector skin.
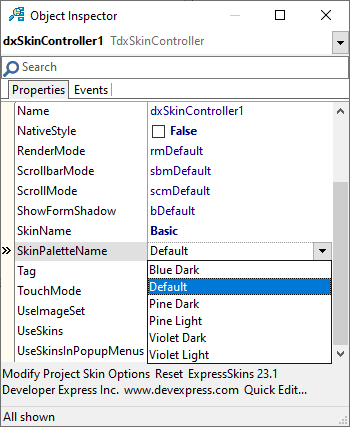
For example, you can select the color scheme named Blue Dark.

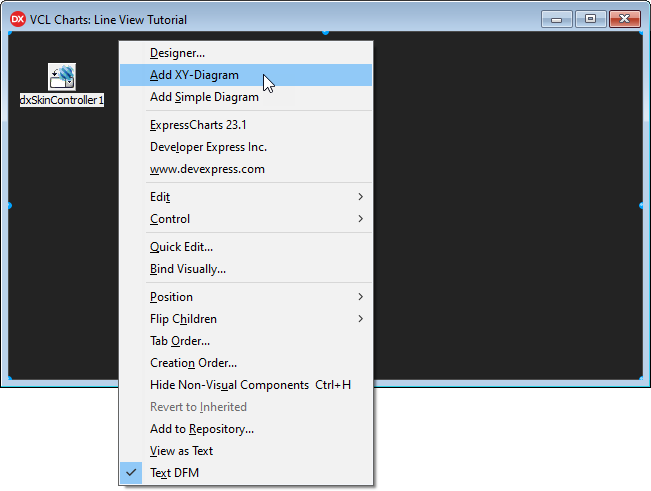
Create an XY Diagram
The Chart control can contain one or more panes called diagrams where you can display and manage series. To display line series, you need to create an XY diagram first.
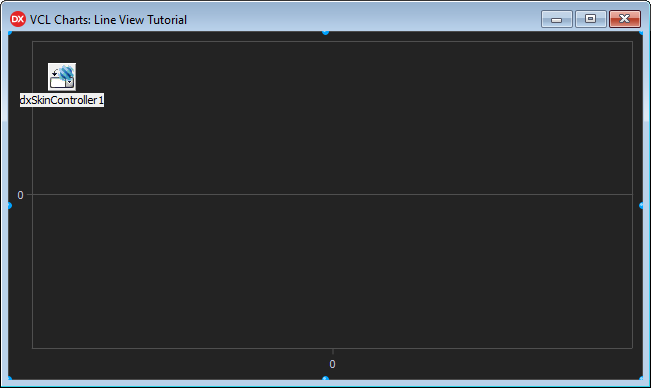
Right-click the Chart control and select the Add XY-Diagram context menu item to create an empty diagram.
An empty XY diagram has the axis of arguments (X-Axis) and the axis of values (Y-Axis) that form a two-dimensional Cartesian coordinate system.
Create Line Series
To create a line series, right-click the Chart control and select Add Line Series.
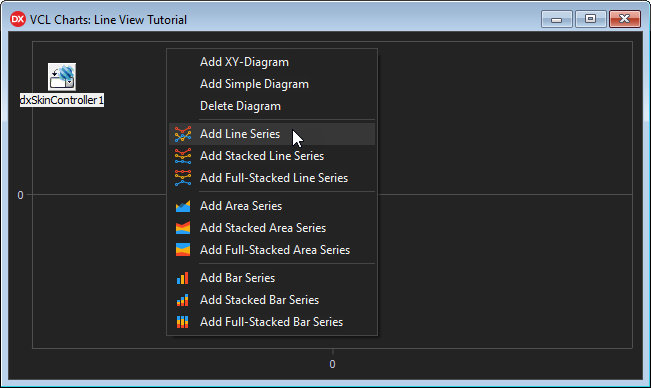
The newly created empty series is displayed in the Chart control’s legend pane to the right of the diagram area.
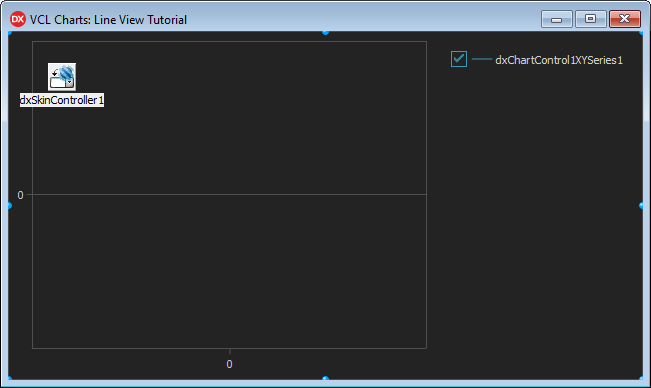
Create two more line series in the same manner.
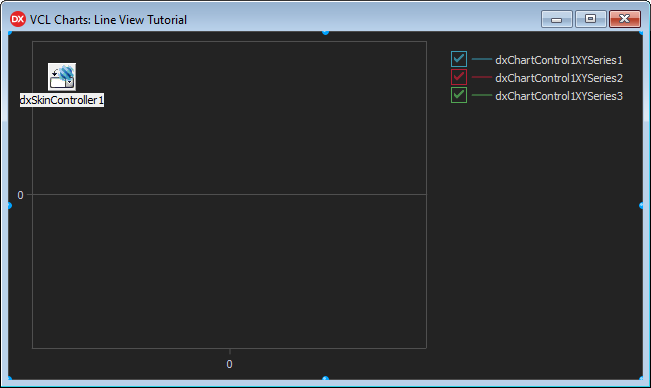
Result
The Chart control contains three empty series and displays their default names in the legend pane to the right of the diagram area.
Next Step
The next step describes how to bind created series to data.