Limit Visible Data
- 2 minutes to read
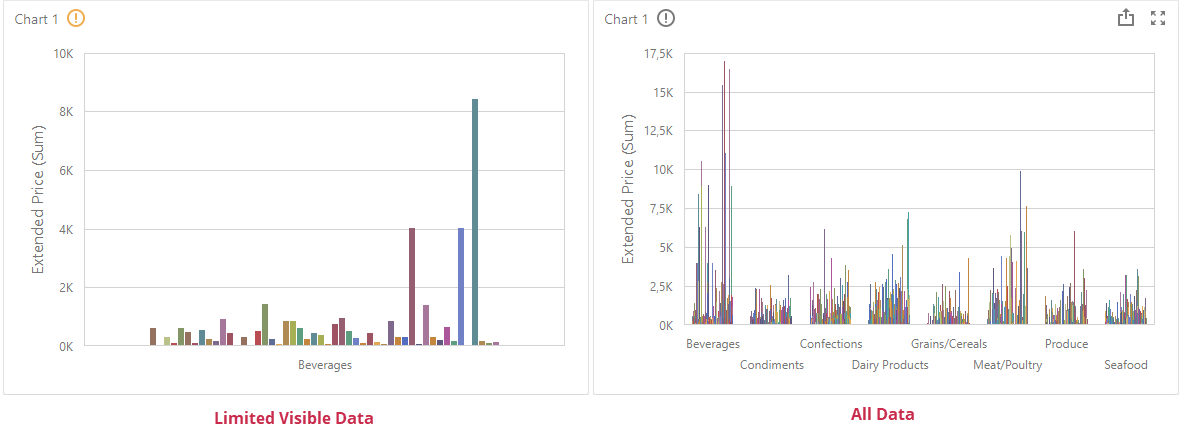
If a dashboard item is bound to a large dataset, the Web Dashboard limits visible data to speed up the rendering of the visual elements when you design a dashboard. First, the dashboard control obtains the underlying data and performs all required calculation. After the calculation process, the control renders the visual elements. At this point, if the number of the data item’s unique values is larger than a certain number N, the dashboard control uses only the first N values to render the elements. The number varies for each dashboard item.
The image below shows the difference between a chart that displays limited visible data and a chart that displays all data:
Tip
If the initial data calculations take time or you need to display all visible data in a dashboard item, limiting visible data is not suitable for performance improvement. In these cases, apply filtering to your data source to improve performance. Refer to the following article for more information: Filter Data Sources.
This topic describes how to configure data limitation settings in the Web Dashboard.
Specify Limitation Mode
Initially, the Web Dashboard limits visible data only in Designer mode. The following data limitation modes are available:
| Value | Description |
|---|---|
Designer |
Visible data is limited only in Designer mode. |
DesignerAndViewer |
Visible data is limited both in Designer and Viewer modes. |
None |
Visible data is not limited. |
Use the following properties/methods to change visible data limitation mode depending on the platform:
- ASP.NET Web Forms
- ASPxDashboard.LimitVisibleDataMode
- ASP.NET MVC
- DashboardExtensionSettings.LimitVisibleDataMode
- ASP.NET Core
- DashboardBuilder.LimitVisibleDataMode
- Blazor
- DxDashboard.LimitVisibleDataMode
- HTML JavaScript
- DashboardControlOptions.limitVisibleDataMode
Note
Visible data limitation does not affect export. For more information about export, refer to the following topic: Exporting in the Web Dashboard.
Data Limitation in the UI
When data limitation occurs, the dashboard control displays a Limit Visible Data icon in the dashboard item’s caption:

When a user hovers over the orange icon, the following message appears:
This dashboard item is bound to a large dataset and does not currently display all data to retain performance. Click this button to display all data.
You can click the icon to load all data. After the data is loaded, the icon color changes to gray:

When a user hovers over the gray icon, the following message appears:
This dashboard item is bound to a large data set. To increase performance, click this icon to limit visible data.