Providing Data
- 5 minutes to read
The Dashboard Designer allows you to bind dashboard items to data in a uniform and similar manner. See the Bind Dashboard Items to Data topic for common information.
The difference is in the data sections that the specific dashboard item has. This topic describes how to bind the Grid dashboard item to data in the Designer or in code.
Binding to Data in the Designer
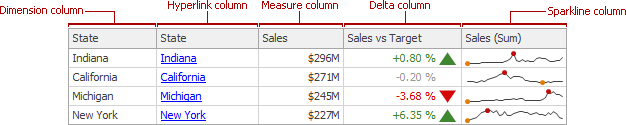
The image below shows a sample Grid dashboard item that is bound to data.

To bind the Grid dashboard item to data, drag and drop a data source field to a placeholder contained in one of the available data sections. A table below lists and describes a Grid’s data sections.
| Section | Processed as | Description |
|---|---|---|
| Columns | Measure or Dimension (depending on the selected column type) | Contains data items that provide values for grid columns. The Options button next to the Column data item allows you to select the column type and specify their options. |
| Sparkline | Dimension | Contains a data item that provides arguments for sparkline columns. To learn more, see Sparkline Column. |
Binding to Data in Code
To provide data for the Grid dashboard item in code, follow the steps below.
Create the required number of columns.
The Grid supports four column types. Each type is a GridColumnBase descendant.
- GridDimensionColumn (the dimension column) displays values in the bound data item “as is”.
- GridMeasureColumn (the measure column) displays summaries calculated against data in the bound data item.
- GridDeltaColumn (the delta column) is bound to two measures, calculates the summaries for both measures, and displays the difference between these summaries.
- GridSparklineColumn (the sparkline column) visualizes the variation of summary values over time.
To learn more about column types, see Column Types Overview.
- Add the created columns to the GridDashboardItem.Columns collection.
Assign data items for each column. The method for assigning data items depends on the column type, as noted in the table below.
Assign the Dimension to the GridDimensionColumn.Dimension property.
Assign the Measure to the GridMeasureColumn.Measure property.
Assign the Measure used to calculate the actual value to the GridDeltaColumn.ActualValue property.
Assign the Measure used to calculate the target value to the GridDeltaColumn.TargetValue property.
Assign the required date-time Dimension to the GridDashboardItem.SparklineArgument property.
Assign the Measure (whose values need to be visualized using sparklines) to the GridSparklineColumn.Measure property.
Example
The following example demonstrates how to create Grid columns and bind a Grid dashboard item to data in code.
As a result, you get the Grid dashboard item with columns created at runtime.
using DevExpress.DashboardCommon;
using DevExpress.DataAccess.Excel;
using DevExpress.XtraEditors;
using System;

namespace Dashboard_CreateGrid {
    public partial class Form1 : XtraForm {
        public Form1() {
            InitializeComponent();

        }
        private void Form1_Load(object sender, EventArgs e) {

            // Creates the Excel data source.
            DashboardExcelDataSource excelDataSource = new DashboardExcelDataSource();
            excelDataSource = CreateExcelDataSource();

            // Creates the Grid dashboard item and adds it to a dashboard.
            Dashboard dashboard1 = new Dashboard();
            dashboard1.DataSources.Add(excelDataSource);
            GridDashboardItem grid = CreateGrid(excelDataSource);
            dashboard1.Items.Add(grid);
            dashboardViewer1.Dashboard = dashboard1;

            // Reloads data in the data sources.
            dashboardViewer1.ReloadData();
        }
        private GridDashboardItem CreateGrid(DashboardExcelDataSource dataSource) {

            // Creates a grid dashboard item and specifies its data source.
            GridDashboardItem grid = new GridDashboardItem();
            grid.DataSource = dataSource;

            // Creates new grid columns of the specified type and with the specified dimension or
            // measure. Then, adds these columns to the grid's Columns collection.
            grid.Columns.Add(new GridHyperlinkColumn(new Dimension("Product"), "Product")
                {UriPattern= "https://www.google.com/search?q={0}" });
            grid.Columns.Add(new GridDimensionColumn(new Dimension("Category")));
            grid.Columns.Add(new GridMeasureColumn(new Measure("Count")));
            grid.Columns.Add(new GridDeltaColumn(new Measure("Count"),
                                                 new Measure("TargetCount")));
            grid.Columns.Add(new GridSparklineColumn(new Measure("Count")));
            grid.SparklineArgument = new Dimension("Date", DateTimeGroupInterval.MonthYear);

            grid.GridOptions.EnableBandedRows = true;
            grid.GridOptions.ShowHorizontalLines = false;

            return grid;
        }

        public DashboardExcelDataSource CreateExcelDataSource() {

            // Generates the Excel Data Source.
            DashboardExcelDataSource excelDataSource = new DashboardExcelDataSource();
            excelDataSource.FileName = @"Data\SimpleDataSource.xls";
            ExcelWorksheetSettings worksheetSettings = new ExcelWorksheetSettings("Simple Data", "A1:F12");
            excelDataSource.SourceOptions = new ExcelSourceOptions(worksheetSettings);
            excelDataSource.Fill();

            return excelDataSource;
        }
    }
}