Data Items Pane
- 2 minutes to read
The DATA ITEMS pane is positioned next to the Data Source Browser, and allows you to use drag-and-drop operations to create and modify data binding.
To learn how to bind dashboard items to data source fields, see the following help topic: Bind Dashboard Items to Data in the Designer.
The DATA ITEMS pane can contain the following elements.
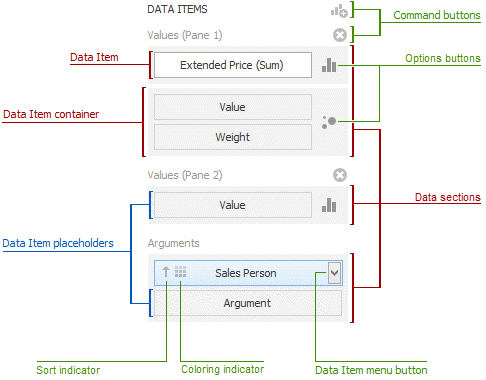
- Data Item placeholder - used to create data binding using drag-and-drop operations.
- Data Item - identifies data binding by mapping to a particular data source field. Each data item has the Data Item menu button, used to invoke a menu that allows you to perform various data shaping operations.
- Data Section - corresponds to a particular dashboard item area or element.
- Data Item container - used to provide data item sets (e.g., for calculating the difference between two measures). Data item containers have Options buttons that allow you to change specific dashboard item settings (e.g., to switch between chart series types or grid column types).
- Sort indicator - shows the current sort order for the data item.
- Coloring indicator - indicates whether color variation by hue is enabled for the data item.
Specific dashboard items have command buttons that allow you to perform various operations, for instance, to add a new pane to the chart dashboard item.