Providing Data
- 5 minutes to read
The Dashboard Designer allows you to bind dashboard items to data in a uniform and similar manner. See the Bind Dashboard Items to Data topic for common information.
The difference is in the data sections that the specific dashboard item has. This topic describes how to bind the Chart dashboard item to data in the Designer or in code.
Binding to Data in the Designer
The image below shows a sample Chart dashboard item that is bound to data.
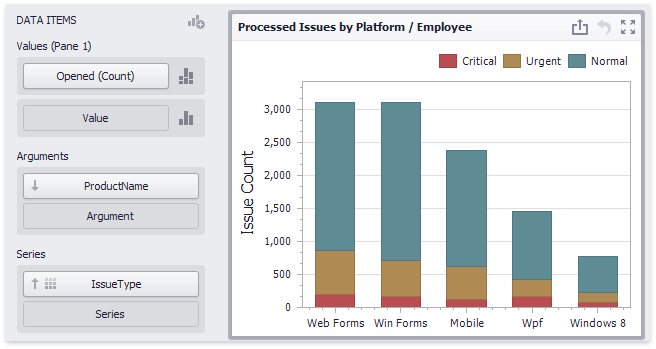
To bind the Chart dashboard item to data, drag and drop a data source field to a placeholder contained in one of the available data sections. The table below lists and describes the Chart’s data sections.
Section | Processed as | Description |
|---|---|---|
Values | Contains data items against which the Y-coordinates of data points are calculated. The Options button next to the Value data item allows you to select the series type and specify different options. Important Note that some types of series accept several measures. To learn more, see the documentation for the required series type. | |
Arguments | Contains data items that provide values displayed along the X-axis of the chart. | |
Series | Contains data items whose values are used to create chart series. |
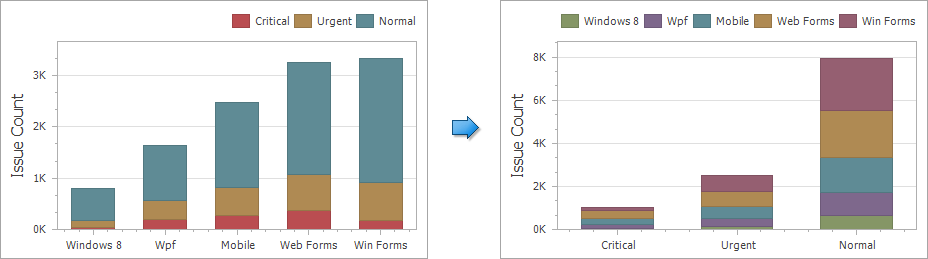
Transposing Arguments and Series
The Chart dashboard item provides the capability to transpose chart arguments and series. In this case, data items contained in the Arguments section are moved to the Series section, and vice versa.
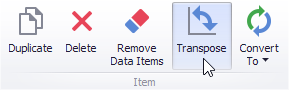
To transpose the selected Chart dashboard item, use the Transpose button in the Home ribbon tab.
Binding to Data in Code
To provide data for the Chart dashboard item, use the following properties.
Arguments | |
Series | |
Values | To provide values that determine the Y-coordinate of data points, first create the required number of panes (ChartPane) and add them to the ChartDashboardItem.Panes collection. Then, create the required series (ChartSeries descendants) for each pane and add the created objects to the ChartPane.Series collections. Finally, assign measures for each series within each pane. The number of measures required and the actual properties to which these measures should be assigned depend on the series type. SimpleSeries (all kinds of bar, point and line, area charts). RangeSeries (range bar or range area charts). WeightedSeries (bubble graphs). HighLowCloseSeries (high-low-close graphs). OpenHighLowCloseSeries (candle stick or stock graphs). |
Example
The following example binds a Chart dashboard item to data in code.
using DevExpress.DashboardCommon;
using DevExpress.XtraEditors;
using System;

namespace Dashboard_CreateChart {
    public partial class Form1 : XtraForm {
        public Form1() {
            InitializeComponent();
        }
        private ChartDashboardItem CreateChart(DashboardObjectDataSource dataSource) {
            // Creates a chart dashboard item and specifies its data source.
            ChartDashboardItem chart = new ChartDashboardItem();
            chart.DataSource = dataSource;

            // Specifies the dimension used to provide data for arguments on a chart.
            chart.Arguments.Add(new Dimension("Sales Person", DateTimeGroupInterval.Year));

            // Specifies the dimension that provides data for chart series.
            chart.SeriesDimensions.Add(new Dimension("OrderDate"));

            // Adds a new chart pane to the chart's Panes collection.
            chart.Panes.Add(new ChartPane());
            // Creates a new series of the Bar type.
            SimpleSeries salesAmountSeries = new SimpleSeries(SimpleSeriesType.Bar);
            // Specifies the measure that provides data used to calculate
            // the Y-coordinate of data points.
            salesAmountSeries.Value = new Measure("Extended Price");
            // Adds created series to the pane's Series collection to display within this pane.
            chart.Panes[0].Series.Add(salesAmountSeries);

            chart.Panes.Add(new ChartPane());
            SimpleSeries taxesAmountSeries = new SimpleSeries(SimpleSeriesType.StackedBar);
            taxesAmountSeries.Value = new Measure("Quantity");
            chart.Panes[1].Series.Add(taxesAmountSeries);

            return chart;
        }
        private void Form1_Load(object sender, EventArgs e) {
            // Creates a dashboard and sets it as the currently opened dashboard in the dashboard viewer.
            dashboardViewer1.Dashboard = new Dashboard();

            // Creates a data source and adds it to the dashboard data source collection.
            DashboardObjectDataSource dataSource = new DashboardObjectDataSource();
            dataSource.DataSource = (new nwindDataSetTableAdapters.SalesPersonTableAdapter()).GetData();
            dashboardViewer1.Dashboard.DataSources.Add(dataSource);

            // Creates a chart dashboard item with the specified data source
            // and adds it to the Items collection to display within the dashboard.
            ChartDashboardItem chart = CreateChart(dataSource);
            dashboardViewer1.Dashboard.Items.Add(chart);

            // Reloads data in the data sources.
            dashboardViewer1.ReloadData();
        }
    }
}
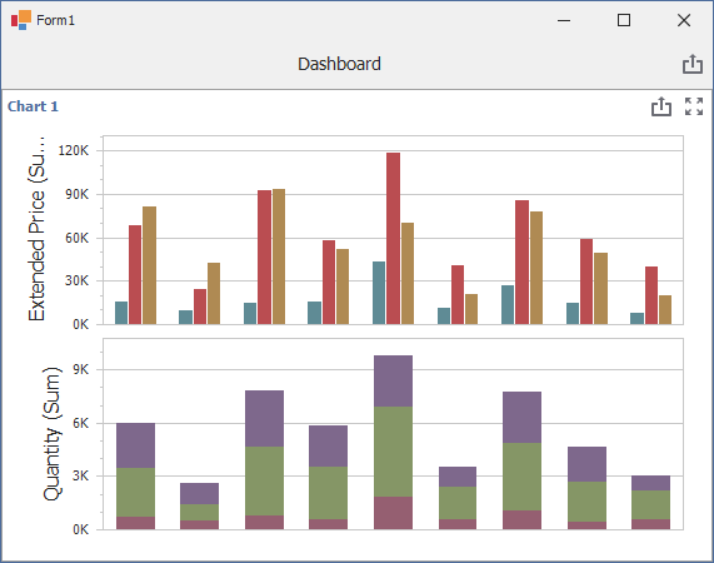
The image below shows the resulting Chart dashboard item: