Point and Line Series
- 2 minutes to read
Point series visualize data as a set of individual numeric data points. Line series are used to connect numeric data points by different types of line segments.
The following types of Point and Line series are available.
Point
Point series visualize data as a set of individual numeric data points.

To specify the type of series as Point in code, set the SimpleSeries.SeriesType property to SimpleSeriesType.Point.
Line
Line series connect numeric data points by straight line segments.
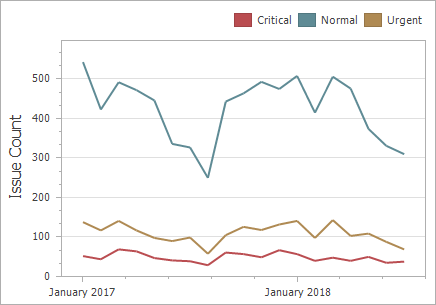
To specify the type of series as Line in code, set the SimpleSeries.SeriesType property to SimpleSeriesType.Line.
Stacked Line
Stacked Line series can be used to show the trend of the contribution for each value.

To specify the type of series as Stacked Line in code, set the SimpleSeries.SeriesType property to SimpleSeriesType.StackedLine.
Full-Stacked Line
Stacked Line series are useful for showing the trend of the percentage for each value.

To specify the type of series as Stacked Line in code, set the SimpleSeries.SeriesType property to SimpleSeriesType.FullStackedLine.
Step Line
Step Line series use vertical and horizontal lines to connect the numeric data points forming a step-like progression.

To specify the type of series as Step Line in code, set the SimpleSeries.SeriesType property to SimpleSeriesType.StepLine.
Spline
Spline series plot a fitted curve through each numeric data point.

To specify the type of series as Spline in code, set the SimpleSeries.SeriesType property to SimpleSeriesType.Spline.