Series Overview
- 4 minutes to read
The Chart dashboard item supports different types of series - from the simple bar and line charts to candlestick and bubble graphs.
Bar series visualize data using rectangular bars with lengths proportional to the values that they represent. | |
Point series visualize data as a set of individual numeric data points. Line series are used to connect numeric data points through different types of line segments. | |
Area series connect numeric data points using different types of line segments and fills the space between the line and X-axis/other series. | |
Range series are used to show variations in a specified time range like temperature, price, etc. | |
Weighted series allow you to visualize data in three dimensions. | |
Financial series are used to illustrate stock prices. |
This topic describes how to change the series type and specify various series options (for instance, how to use a secondary axis or enable point labels).
Series Types
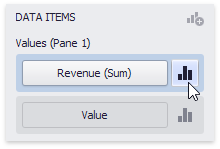
To switch between series types in the Dashboard Designer, click the Options button next to the required data item (or placeholder) in the Values section.
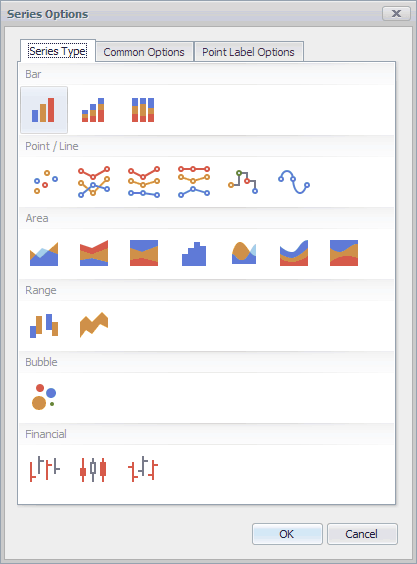
In the invoked Series Options dialog, select the required series type and click OK.
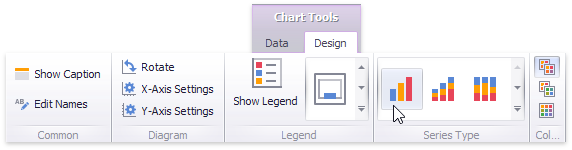
You can also do this using the Series Type gallery in the Design Ribbon tab.
When you initialize a Chart dashboard item in code, the series type is defined by the ChartSeries descendant type contained in the ChartPane.Series collection. Specific ChartSeries descendants expose the SeriesType property (SimpleSeries.SeriesType, RangeSeries.SeriesType, etc.). These are classes that can represent several series types and can be selected using the SeriesType property. See the individual series topics listed at the beginning of this document for more information on each series.
Series Options
To manage common series options, use the Common Options tab of the Series Options dialog.
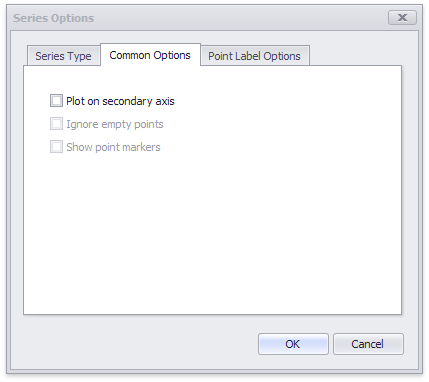
You can specify the following settings:
Option | Description | API |
|---|---|---|
Plot on secondary axis | Specifies whether to use the secondary axis to plot the current series. | |
Ignore empty points | Specifies whether to ignore empty points when plotting the current series. | |
Show point markers | Specifies whether to show the current series’s point markers. This option is in effect for the following series:
Note Point markers are always shown when the Chart dashboard item’s Master Filtering is enabled. |
Series Point Labels
The Series Options dialog’s Point Label Options tab allows you to enable series point labels and manage their settings.
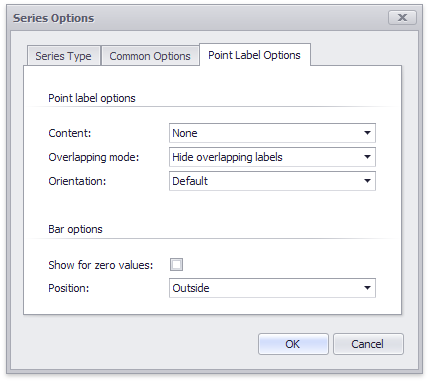
You can specify the following settings for point labels:
Option | Description | API |
|---|---|---|
Content | Specifies the type of content displayed in point labels. You can select a single or several values from the drop-down list:
| |
Overlapping mode | Specifies the label overlapping mode. The following options are available:
| |
Orientation | Specifies point labels’ orientation. The following options are available:
|
The following options are in effect for Bar series only:
| Option | Description | API |
|---|---|---|
| Show for zero values | Specifies whether to display labels for points with zero values. | PointLabelOptions.ShowForZeroValues |
| Position | Specifies point labels’ position relative to bars. | PointLabelOptionsBase.Position |
Use the ChartSeries.PointLabelOptions property to manage point labels in code.