Debug Visualizer
- 2 minutes to read
The Debug Visualizer simplifies the debugging process. It displays expression values directly within the code, provides a preview of future values (for lines of code about to be executed), and documents historical values inside the method.
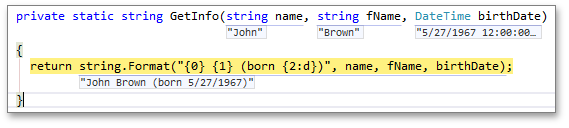
You can view the value of each part of an expression, as well as the entire expression value. Double-click the expression value located under the expression, or press ALT+Down Arrow to view the values of expression parts. Use the arrow keys to navigate through values.

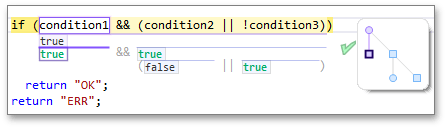
The Debug Visualizer also visually shows whether or not a conditional statement is true ( ) or false (
 ). If a Boolean expression consists of several parts, the Debug Visualizer highlights the child expressions that determine the parent value.
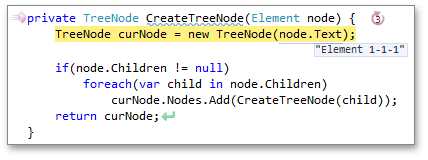
The recursive method call counter allows you to easily obtain the depth of recursion. It is displayed to the right of a method declaration if the method is called from itself one or more times.
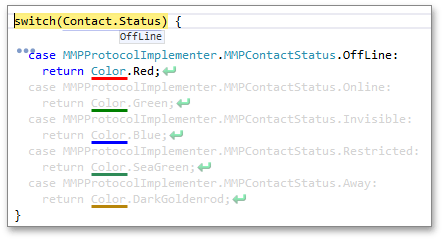
The Debug Visualizer de-emphasizes missed code blocks to highlight the current execution path.
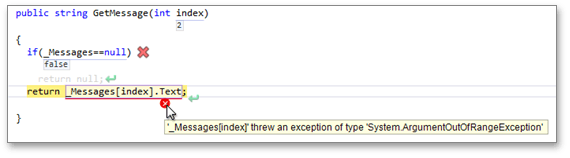
CodeRush Classic marks expressions that cause an exception with a red icon. Place the mouse pointer over the icon to see a tooltip with detailed information on the exception.
The Debug Visualizer enables you to generate unit tests for public methods using the runtime values of a method’s input parameter.
You can generate a test using the appropriate shortcut (CTRL+SHIFT+ALT+T by default). As the test cannot be added at runtime, the data required to generate the test is added to the Unit Test Builder tool window. After you finish debugging, CodeRush Classic generates the tests listed in this window.
Note
Code
Specify the feature options via the Visualizer options page. To modify the Debug Visualizer colors, use the Debug Visualizer options page.
Note
This product is designed for outdated versions of Visual Studio. Although Visual Studio 2015 is supported, consider using the Code