Scale Breaks
- 4 minutes to read
This topic describes how an axis (as well as the diagram to which it belongs) can be divided into multiple scale ranges, separated by scale breaks. Before you proceed with this section, you may wish to review the following help topic on axis fundamentals: Axes Overview.
This document consists of the following sections.
- Scale Break Overview
- Auto Scale Breaks
- Insert a Scale Break Manually
- Customize Scale Break Appearance
Scale Break Overview
A scale break is an area across an axis that is shown in place of a section of the axis range. It appears across the original axis as a ragged, wavy or straight line.
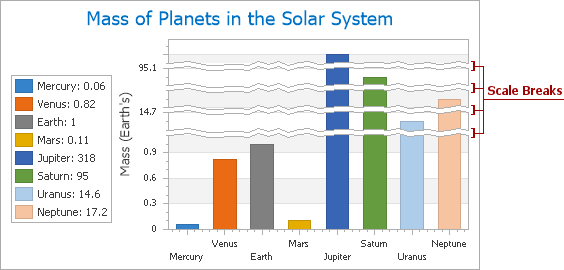
The most common reason to use scale breaks is to save chart space. This happens when the chart’s series displays data with great leaps in its range (e.g., when series use significantly different values such as decimals and thousands). The scale break allows you to save chart space, and skip segments of the range with no series points or values.
Note
Scale breaks are supported for all series views that are compatible with the XY-Diagram.
You can add multiple scale breaks to an axis of any scale type, regardless of whether the axis uses a logarithmic scale.
When you add scale breaks, it does not matter whether their ranges intersect, or exceed the visible axis range. The ASP.NET Chart Control will automatically merge intersecting scale breaks, and adjust the axis range. Scale breaks depend on the settings of axis scale elements (for example, axis grid lines, tickmarks, and axis labels).
The web chart control allows you to use automatic, manual, or both automatic and manual scale breaks. These approaches are highlighted below in the corresponding sections.
Auto Scale Breaks
You can use the Axis.AutoScaleBreaks property to force the WebChartControl to automatically insert scale breaks into an axis. To do this at design time, locate the axis in the Properties window, expand the Axis.AutoScaleBreaks property, and set the AutoScaleBreaks.Enabled property to true.

Then, if your chart’s data suggests a scale break, it will be created automatically.
You can use the AutoScaleBreaks.MaxCount property (whose minimum value is 1) to limit the maximum number of automatic scale breaks.
Note that auto-calculated scale breaks and manually added scale breaks can co-exist in the ScaleBreakCollection.
Refer to the following help topic for more information: How to: Enable Automatic Scale Breaks for an Axis.
Insert a Scale Break Manually
You can also assign scale breaks to an axis manually.
A scale break is an instance of the ScaleBreak class, which resides in the ScaleBreakCollection of an axis.
To access this collection at design time, locate the axis in the Properties window, and click the Axis.ScaleBreaks property’s ellipsis button.

This invokes the Scale Break Collection Editor.

After a scale break is added to the collection, define the scale break’s range. The limits of this range are determined by two properties: ScaleBreak.Edge1 and ScaleBreak.Edge2.

The values of these properties should be defined in measurement units appropriate for the axis scale type.
Note
The values of the ScaleBreak.Edge1 property and the ScaleBreak.Edge2 property must be different. If these property values are equal, the scale break is considered invisible.
To define a custom name for a scale break, use its ChartElementNamed.Name property.
Refer to the following help topics for more information:
- How to: Manually Insert a Scale Break into an Axis
- How to: Manually Insert a Scale Break into an Axis (Runtime Sample)
Customize Scale Break Appearance
To define the overall appearance for both automatic and manual scale breaks, use the Axis.ScaleBreakOptions property.

This property allows you to access the following options:
- The ScaleBreakOptions.Color property determines the color of the scale break edges;
- The ScaleBreakOptions.SizeInPixels property determines the width of scale breaks, in pixels;
- The ScaleBreakOptions.Style property allows you to choose whether scale break edges are straight, wavy or ragged.