Axes
- 3 minutes to read
This document details the use of axes in the ASP.NET Chart Control: their purpose, implementation and capabilities. It explains axis scale types and axis ranges, and how to use primary and secondary axes and axis elements. Before reading this text, it may be useful to review Charting Basics. To learn more on the hierarchy of elements in the ASP.NET Chart Control, refer to Chart Elements.
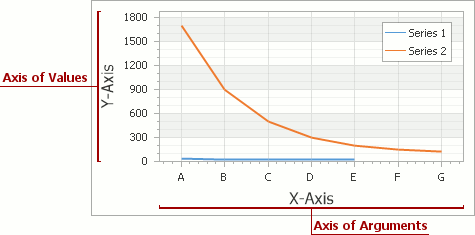
A rectangular coordinate system is used to determine each unique point on a plane - based on the point’s argument and value. Two perpendicular lines - the horizontal axis of arguments (the X-axis) and the vertical axis of values (the Y-axis) - are used to define the chart’s coordinates.
You can use the XYDiagram.Rotated property to rotate the axes, so that the X-axis is vertical and the Y-axis is horizontal.
Note
If you flip the X-axis and the Y-axis, the functionality of the axes do not change. The X-axis is still the axis of arguments, and the Y-axis is the axis of values.
Structurally, axes belong to a chart’s diagram object, and the diagram types which support axes are: XY-Diagram, Gantt Diagram, XY-Diagram 3D and Radar Diagram. Since these diagram types support different series view types, the technique used to implement a specific axis depends on the diagram type. To demonstrate axes’ functionality, the most common diagram type - XY-Diagram is used in this document.
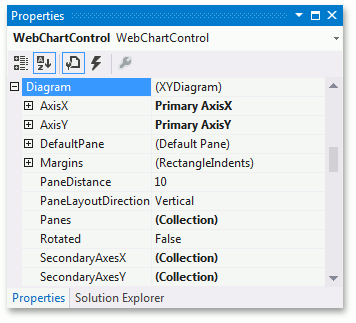
You can access axes at design time. To do this, select the chart control, and in the Properties window, expand the WebChartControl.Diagram property. The XYDiagram.AxisX and XYDiagram.AxisY properties located under the Diagram property allow you to access axis options and elements.
At runtime, cast the Diagram object’s instance to the required type to access axes (see the code below).
In the ASP.NET Chart Control, there is a stiff inter-dependence between the scale type of series and axes. Series points should have their arguments and values defined, and these arguments (and their values) should match the scale type of its corresponding axis: Numerical, DateTime, TimeSpan or Qualitative. Note that you do not need to change the argument scale type of the SeriesBase.ArgumentScaleType property (set to the Auto mode, by default) because the type of series point argument is detected automatically based on the type of underlying data. To learn more, refer to Axis Scale Types.
Another notable feature is the capability to limit the visible range of an axis. To learn more, refer to the following help topic: Axis Range.
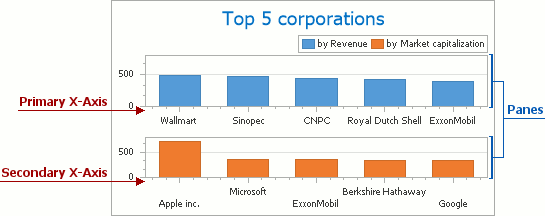
Besides primary axes, it is possible to add secondary axes to a diagram’s collection. You can assign them to the required series instead of the primary axes, and distribute them among separate panes. Refer to the following help topic for details: Primary and Secondary Axes.
You can customize the appearance of each axis in many different ways. For more information, refer to the following help topics:
In addition, the XYDiagram.AxisX and XYDiagram.AxisY properties allow you to access axis child elements: axis title, axis labels, strips and constant lines. For a detailed description of each element, refer to the corresponding topic. These elements are shown in the following image.

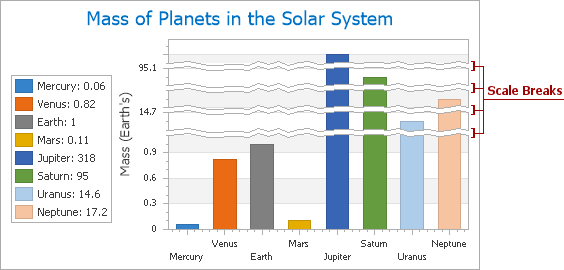
You can insert a scale break on any axis, to replace a section of the axis range with a wavy line. This line indicates a significant difference between high and low values.