Full-Stacked Line Chart
- 2 minutes to read
Short Description
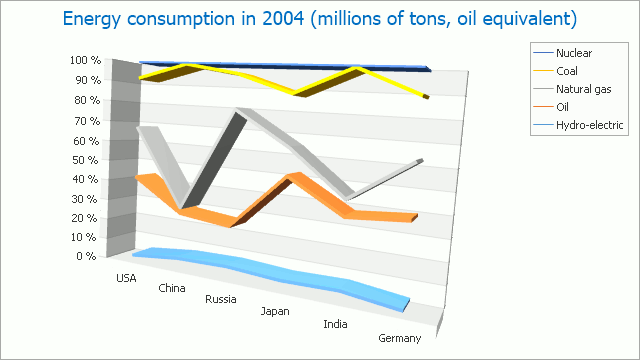
A FullStackedLine3DSeriesView object is used to display the Full-Stacked Line chart (100%-Stacked Line Chart). This chart type belongs to the Point, Line and Spline Series View type. This view displays all series in a stacked manner. It allows you to compare how much each series contributes to the total aggregate value for specific arguments (as percentages).
A Full-Stacked Line chart is shown in the image below.
Note
A Full-Stacked Line chart can display series that contain data points with positive or negative values. A series with positive values, however, is stacked only with other series that contain positive values; and a series with negative values is stacked with series that contain negative values.
Note that if a series contains data points with both positive and negative values, it is treated as a series with positive values, while all its negative values are treated as zeros.
Chart Type Characteristics
The table below lists the main characteristics of this chart type.
| Feature | Value |
|---|---|
| Series View type | FullStackedLine3DSeriesView |
| Diagram type | XYDiagram3D |
| Number of arguments per series point | 1 |
| Number of values per series point | 1 |
Note
For information on which chart types can be combined with the Full-Stacked Line Chart, refer to the following help topic: Combining Different Series Views.