How to: Customize Gridlines and Tickmarks of an Axis
- 2 minutes to read
This example demonstrates how the grid lines and tickmarks of an axis can be customized at runtime.
To access an axis, you should cast your chart’s diagram object to the required diagram type. Then, use the Axis2D.Tickmarks and AxisBase.GridLines properties to access the corresponding elements. To define the number of minor tickmarks (grid lines), use the AxisBase.MinorCount property.
// Cast the chart's diagram to the XYDiagram type, to access its axes.
XYDiagram diagram = (XYDiagram)chartControl1.Diagram;

// Customize the appearance of the axes' tickmarks.
diagram.AxisX.Tickmarks.CrossAxis = true;
diagram.AxisX.Tickmarks.Length = 5;
diagram.AxisX.Tickmarks.Thickness = 2;

diagram.AxisY.Tickmarks.Visible = false;
diagram.AxisY.Tickmarks.MinorVisible = false;

diagram.AxisX.Tickmarks.MinorLength = 3;
diagram.AxisX.Tickmarks.MinorThickness = 1;

diagram.AxisX.MinorCount = 2;
diagram.AxisY.MinorCount = 4;

// Customize the appearance of the axes' grid lines.
diagram.AxisX.GridLines.Visible = false;
diagram.AxisX.GridLines.MinorVisible = false;

diagram.AxisY.GridLines.Visible = true;
diagram.AxisY.GridLines.MinorVisible = true;

diagram.AxisY.GridLines.Color = Color.Red;
diagram.AxisY.GridLines.LineStyle.DashStyle = DashStyle.Solid;
diagram.AxisY.GridLines.LineStyle.Thickness = 2;

diagram.AxisY.GridLines.MinorColor = Color.Blue;
diagram.AxisY.GridLines.MinorLineStyle.DashStyle = DashStyle.Dash;
diagram.AxisY.GridLines.MinorLineStyle.Thickness = 1;
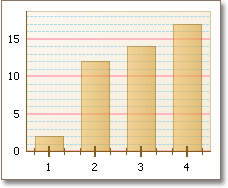
The result is shown in the following image.
Tip
A complete sample project is available in the DevExpress Code Examples database at http://www.devexpress.com/example=E1367.
See Also