Whole and Visual Ranges
- 4 minutes to read
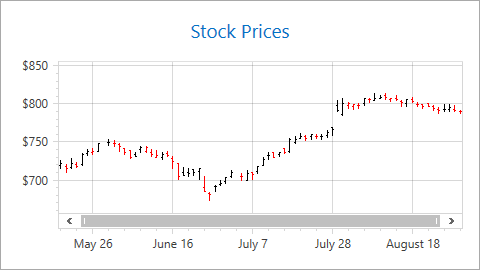
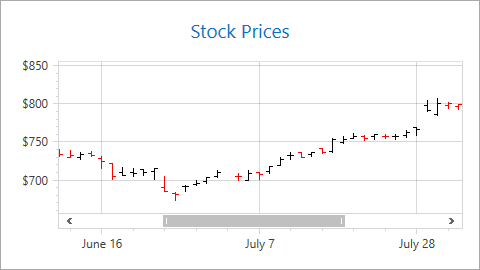
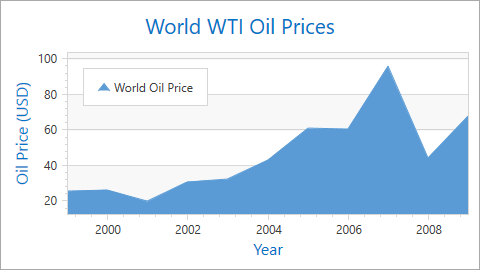
Whole and visual axis ranges define which data an axis displays. The whole range is automatically calculated based on the data of all series associated with the axis. A chart does not show values that are outside the range. A visual range is equal to a whole range by default and determines the data range the Chart control currently displays.
| An x-axis’s visual range is equal to a whole range | An x-axis’s visual range is less than a whole range |
|---|---|
 |
 |
Note
The following axes types allow you to operate with their whole or visual ranges:
- A whole range is available for Axis and CircularAxisY2D class descendants, and the RadarAxisX2D class object.
- A visual range is available for Axis2D class descendants.
This document consists of the following sections:
- How End User Can Change a Visual Range
- How to Configure Visual and Whole Ranges
- How to Specify Diagram Side Margins
- How to Hide Zero Level on a Chart Value Axis
- How to Configure Y-Axis’s Range Based on X-Axis’s Visual Range
How End User Can Change a Visual Range
An end user changes a visual range when zooming and scrolling a chart. Note that, changing the visual range does not affect the whole range.
Use the markup below to enable scrolling and zooming in a chart:
<dxc:XYDiagram2D EnableAxisXNavigation="True"
                 EnableAxisYNavigation="True">
<!--...-->
</dxc:XYDiagram2D>
The code uses the following classes and properties:
| Class or Property | Description |
|---|---|
| XYDiagram2D | The XY Diagram. |
| XYDiagram2D.EnableAxisXNavigation | Specifies whether an end user can scroll and zoom a chart’s x-axis. |
| XYDiagram2D.EnableAxisYNavigation | Specifies whether an end user can scroll and zoom a chart’s y-axis. |
How to Configure Visual and Whole Ranges
The following markup shows how to specify visual and whole ranges:
<!--...-->
<dxc:XYDiagram2D.AxisX>
    <dxc:AxisX2D>
        <dxc:AxisX2D.WholeRange>
            <dxc:Range MinValue="05/24/2016"
                       MaxValue="08/25/2016"/>
        </dxc:AxisX2D.WholeRange>
        <dxc:AxisX2D.VisualRange>
            <dxc:Range MinValue="06/18/2016"
                       MaxValue="07/03/2016"/>
        </dxc:AxisX2D.VisualRange>
    </dxc:AxisX2D>
</dxc:XYDiagram2D.AxisX>
<!--...-->
The markup above uses the following classes and properties:
| Class or Property | Description |
|---|---|
| Axis.WholeRange | Gets or sets the axis whole range’s settings. |
| Axis2D.VisualRange | Gets or sets the axis visual range’s settings. |
| Range | The axis range. |
| Range.MinValue | The range’s minimum limit. |
| Range.MaxValue | The range’s maximum limit. |
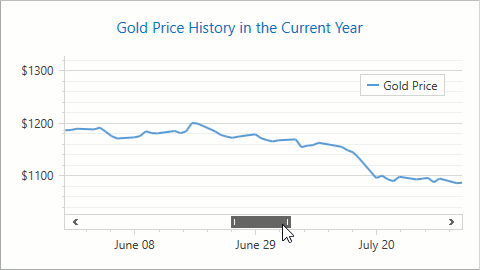
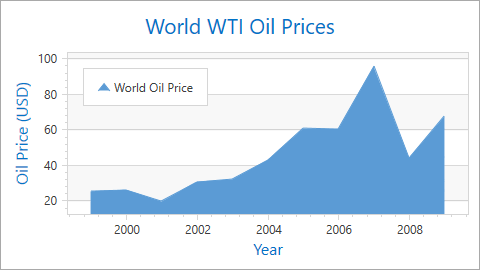
How to Specify Diagram Side Margins
You can modify the space between the first series point and left diagram edge, and the last series point and right diagram edge . For this, specify custom side margins using the Range.SideMarginsValue property:
AutoSideMargins = true | SideMarginsValue = 0 (AutoSideMargins = false) |
|---|---|
|
|
The following example shows how to change these distances:
<dxc:XYDiagram2D.AxisX>
    <dxc:AxisX2D>
        <dxc:AxisX2D.WholeRange>
            <dxc:Range SideMarginsValue="0"/>
        </dxc:AxisX2D.WholeRange>
    </dxc:AxisX2D>
</dxc:XYDiagram2D.AxisX>
The markup above uses the following classes and properties:
| Class or Property | Description |
|---|---|
| Axis.WholeRange | Gets or sets an axis whole range. |
| Range | The range. |
| Range.AutoSideMargins | Specifies whether to automatically calculate margins between extreme series points and diagram’s edges. |
| Range.SideMarginsValue | Gets or sets custom margins. This value is measured in axis units. |
How to Hide Zero Level on a Chart Value Axis
When a y-axis range is automatically calculated, you can use the AlwaysShowZeroLevel property to hide the zero value level. In this case, a new optimal minimum value is specified for the y-axis:
| AlwaysShowZeroLevel = true | AlwaysShowZeroLevel = false |
|---|---|
 |
 |
Use the code below to hide a y-axis’s zero level:
<dxc:XYDiagram2D>
    <dxc:XYDiagram2D.AxisY>
        <dxc:AxisY2D>
            <dxc:AxisY2D.WholeRange>
                <dxc:Range dxc:AxisY2D.AlwaysShowZeroLevel="False"/>
            </dxc:AxisY2D.WholeRange>
        </dxc:AxisY2D>
    </dxc:XYDiagram2D.AxisY>
    <!--...-->
</XYDiagram2D>
The markup uses the following classes and properties:
| Class or Property | Description |
|---|---|
| Axis.WholeRange | The axis’s whole range. |
| Range | An axis’s range. |
| AxisY2D.AlwaysShowZeroLevel | Specifies whether to show the XY Diagram’s y-axis zero level. |
Use the following properties to hide the zero level in 3D charts and circular charts (Polar and Radar series):
How to Configure Y-Axis’s Range Based on X-Axis’s Visual Range
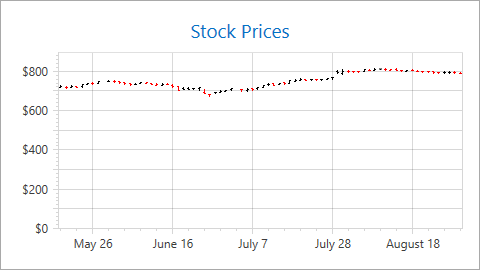
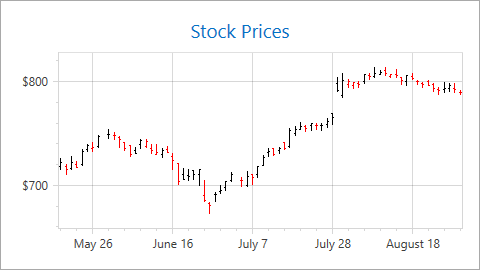
The XYDiagram2D.DependentAxesYRange option allows you to only display y-axis values for point values that are in the x-axis’s visual range.
| DependentAxesYRange = false | DependentAxesYRange = true |
|---|---|
 |
 |
The following markup shows how to do this:
<dxc:ChartControl>
    <dxc:XYDiagram2D DependentAxesYRange="True">
        <dxc:XYDiagram2D.AxisX>
            <dxc:AxisX2D StickToEnd="True"/>
        </dxc:XYDiagram2D.AxisX>
        <!--...-->
    </dxc:XYDiagram2D>
</dxc:ChartControl>
The markup uses the following classes and properties:
| Class or Property | Description |
|---|---|
| XYDiagram2D.DependentAxesYRange | Gets or sets the value indicating whether all y-axes’ visual ranges should be calculated only by point values in the x-axis’s visual range. |
| AxisX2D.StickToEnd | Gets or sets the value indicating whether the visual range should always be in the end of the constantly changing whole range. |