Display Series Error and Trend Indicators with DevExpress Presentation API
- 4 minutes to read
The DevExpress Presentation API allows you to add series indicators to a Chart. You can use error bars to visualize data variability and a trend line to highlight direction in your data.
Supported Series Types
You can add error bars and a trend line to the following series:
Add Error Bars
Each series can have one vertical and one horizontal error bar instance.
Use the series ErrorBars property to access a series error bar collection. Add an ErrorBar object and configure its properties:
- ErrorBar.Axis
- Specifies the axis used to calculate error values. Available values include:
Vertical,Horizontal,Both. - ErrorBar.Direction
- Specifies the direction of error bars. Available values include:
Plus,Minus,Both. - ErrorBar.Type
- Specifies the type of error bars. Available values include:
FixedValue,Percentage,StandardDeviation,StandardError,Custom. For error bars with custom error values (ErrorBar.TypeisCustom), use the ErrorBar.Minus and ErrorBar.Plus properties to specify custom error values. These properties accept a IChartValueData objects (such as ChartDataReference or ChartNumericData). - ErrorBar.Value
- Specifies the value of error bars.
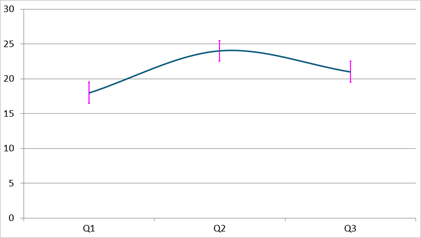
The following code snippet adds vertical fixed-value error bars to a line series:
using DevExpress.Docs.Office;
using DevExpress.Docs.Presentation;
using System.Drawing;

//...
Chart chart = new Chart();
chart.Width = presentation.SlideSize.Width;
chart.Height = presentation.SlideSize.Height;
slide.Shapes.Add(chart);

chart.Data[0, "A1"].TextValue = "Q1";
chart.Data[0, "A2"].TextValue = "Q2";
chart.Data[0, "A3"].TextValue = "Q3";
chart.Data[0, "B1"].NumericValue = 18;
chart.Data[0, "B2"].NumericValue = 24;
chart.Data[0, "B3"].NumericValue = 21;

LineSeries lineSeries = new LineSeries();
lineSeries.Arguments = new ChartDataReference(0, "A1", "A3");
lineSeries.Values = new ChartDataReference(0, "B1", "B3");
chart.Series.Add(lineSeries);

lineSeries.ErrorBars = new ErrorBarCollection {
        new ErrorBar {
            Axis = ErrorBarAxis.Vertical,
            Direction = ErrorBarDirection.Both,
            Type = ErrorValueType.FixedValue,
            Value = 1.5,
            ShowCap = true,
            OutlineStyle = new OutlineStyle { Fill = new SolidFill(Color.Magenta), Width = 8 }
        }
    };
Add a Trend Line
Use the TrendLine property to assign a TrendLine object to a series.
The following properties allow you to configure a trend line:
- TrendLine.Type
- Specifies the type of the trend line. Available values include:
Linear,Exponential,Logarithmic,Polynomial,Power. - TrendLine.ShowEquationLabel
- Specifies whether to display the equation formula of the trend line.
- TrendLine.ShowRSquaredValue
- Specifies whether to display the R-squared value of the trend line.
- TrendLine.ForecastForward
- Specifies the number of points to forecast forward.
- TrendLine.ForecastBackward
- Specifies the number of points to forecast backward.
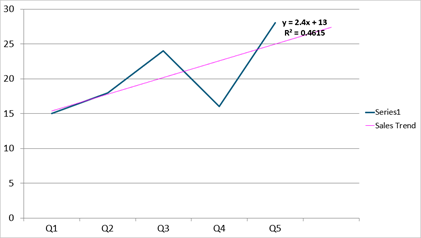
The following code snippet adds a linear trend line and displays equation and R-squared values:
using DevExpress.Docs.Office;
using DevExpress.Docs.Presentation;
using System.Drawing;

LineSeries lineSeries = new LineSeries();
lineSeries.Arguments = new ChartStringData(new[] { "Q1", "Q2", "Q3", "Q4", "Q5" });
lineSeries.Values = new ChartNumericData(new[] { 15d, 18d, 24d, 16d, 28d });
chart.Series.Add(lineSeries);

lineSeries.TrendLine = new TrendLine {
    Name = "Sales Trend",
    Type = TrendLineType.Linear,
    ShowEquationLabel = true,
    ShowRSquaredValue = true,
    ForecastForward = 1,
    EquationLabelOptions = new TrendLineLabel { TextProperties = new TextProperties { FontSize = 20, Bold = true } },
    OutlineStyle = new OutlineStyle { Fill = new SolidFill(Color.Magenta), Width = 4 }
};