Providing Data
- 5 minutes to read
The Dashboard Designer allows you to bind dashboard items to data in a uniform and similar manner. See the Bind Dashboard Items to Data topic for common information.
The difference is in the data sections that the specific dashboard item has. This topic describes how to bind the Card dashboard item to data in the Designer or in code.
Binding to Data in the Designer
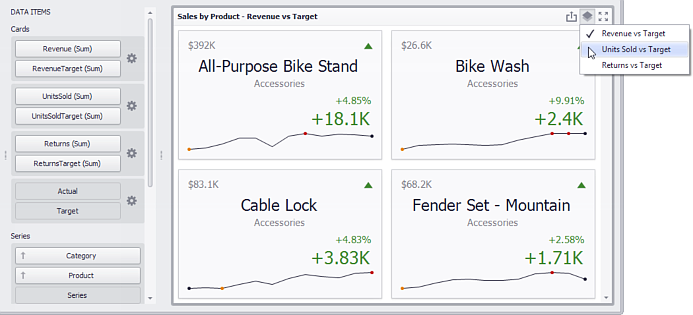
The image below shows a sample Card dashboard item that is bound to data.
To bind the Card dashboard item to data, drag and drop a data source field to a placeholder contained in one of the available data sections. A table below lists and describes Card data sections.
Section | Processed as | Description |
|---|---|---|
Cards | Measure (both Actual and Target values) | Contains data items used to calculate values displayed within cards. Data items are arranged in containers. Each data item container can hold two data items. The first item contains actual data and the second item (optional) contains target data. If both items are provided, cards show the difference between actual and target values. You can fill several data item containers in the Cards section and use the Values drop-down menu to switch between the provided values. To invoke the Values menu, click the Note This drop-down menu is available if the Series section is not empty. Otherwise, a separate card is created for each data item container, and all cards are displayed simultaneously. |
Series | Contains data items whose values are used to label cards. | |
Sparkline | Provide a dimension whose data will be used to visualize values using sparklines. |
 icon in the dashboard item
 Binding to Data in Code
To provide data for the Card dashboard item, use the following properties.
Series | |
Values | To provide data used to calculate values displayed within cards, do the following.
|
Example
The following example shows how to bind a Card dashboard item to data in code.
using DevExpress.DashboardCommon;
using DevExpress.DataAccess.Excel;
using DevExpress.XtraEditors;

namespace DXApplication1
{
    public partial class ViewerForm1 : XtraForm
    {
        public ViewerForm1()
        {
            InitializeComponent();

            dashboardViewer.Dashboard = new Dashboard();

            // Creates a data source and adds it to the dashboard data source collection.
            DashboardExcelDataSource excelDataSource = new DashboardExcelDataSource();
            excelDataSource = CreateExcelDataSource();
            dashboardViewer.Dashboard.DataSources.Add(excelDataSource);

            // Creates a card dashboard item with the specified data source
            // and adds it to the Items collection to display within the dashboard.
            CardDashboardItem cards = CreateCards(excelDataSource);
            dashboardViewer.Dashboard.Items.Add(cards);

            // Reloads data in the data sources.
            dashboardViewer.ReloadData();
        }
        private CardDashboardItem CreateCards(DashboardExcelDataSource dataSource)
        {
            // Creates a card dashboard item and specifies its data source.
            CardDashboardItem cards = new CardDashboardItem();
            cards.DataSource = dataSource;

            // Creates the Card object with measures that provide data for calculating actual and target
            // values, and then adds this object to the Cards collection of the card dashboard item.
            Card card = new Card();
            card.ActualValue = new Measure("RevenueQTD (Sum)");
            card.TargetValue = new Measure("RevenueQTDTarget (Sum)");
            cards.Cards.Add(card);

            // Specifies dimensions that provides data for a card dashboard item series.
            cards.SeriesDimensions.Add(new Dimension("Category"));
            cards.SeriesDimensions.Add(new Dimension("Product"));
            cards.InteractivityOptions.IsDrillDownEnabled = true;

            return cards;
        }
        public DashboardExcelDataSource CreateExcelDataSource()
        {
            // Generates the Excel Data Source.
            DashboardExcelDataSource excelDataSource = new DashboardExcelDataSource();
            excelDataSource.FileName = @"Data\Sales.xlsx";
            ExcelWorksheetSettings worksheetSettings = new ExcelWorksheetSettings("Sheet1", "A1:I4166");
            excelDataSource.SourceOptions = new ExcelSourceOptions(worksheetSettings);
            excelDataSource.Fill();

            return excelDataSource;
        }
    }

}