Axis Range
- 9 minutes to read
The Chart Control allows you to modify ranges for x- and y-axes.
| Show all data. The range is not limited | Show data from February 1, 2019 to July 31, 2019 |
|---|---|
 |
 |
Configure Ranges
Use the AxisBase.WholeRange property to customize range settings.
Note
Do not use the AxisBase.VisualRange property on the ASP.NET platform. VisualRange is designed for zoom and scroll functionality in WinForms charts.
To limit the axis range, set the WholeRange.MinValue and WholeRange.MaxValue properties or call the WholeRange.SetMinMaxValues method.
Important
You should specify the MeasureUnit property before you limit ranges. When you change an axis’s MeasureUnit property (DateTimeScaleOptions.MeasureUnit, TimeSpanScaleOptions.MeasureUnit or NumericScaleOptions.MeasureUnit), the range limits are reset to default values.
The following examples show how to configure a range for different axis types:
Limit the Numeric Axis Range
XYDiagram diagram = (XYDiagram)WebChartControl1.Diagram;
// Set limits for an x-axis's entire range...
diagram.AxisX.WholeRange.MinValue = 500;
diagram.AxisX.WholeRange.MaxValue = 2000;
// or use the SetMinMaxValues method to specify range limits.
diagram.AxisX.WholeRange.SetMinMaxValues(500, 2000);
Limit the Date-Time Axis Range
XYDiagram diagram = (XYDiagram)WebChartControl1.Diagram;
// Set limits for an x-axis's entire range...
diagram.AxisX.WholeRange.MinValue = new DateTime(2017, 01, 01);
diagram.AxisX.WholeRange.MaxValue = new DateTime(2019, 12, 31);
// or use the SetMinMaxValues method to specify range limits.
diagram.AxisX.WholeRange.SetMinMaxValues(new DateTime(2017, 01, 01), new DateTime(2019, 12, 31));
Limit the Time-Span Axis Range
XYDiagram diagram = (XYDiagram)WebChartControl1.Diagram;
// Set limits for an x-axis's entire range...
diagram.AxisX.WholeRange.MinValue = new TimeSpan(0,0,0);
diagram.AxisX.WholeRange.MaxValue = new TimeSpan(1, 0, 0, 0);
// or use the SetMinMaxValues method to specify range limits.
diagram.AxisX.WholeRange.SetMinMaxValues(new TimeSpan(0, 0, 0), new TimeSpan(1, 0, 0, 0));
Limit the Qualitative Axis Range
XYDiagram diagram = (XYDiagram)WebChartControl1.Diagram;
// Use the actual string values from the data source.
// Set limits for an x-axis's entire range...
diagram.AxisX.WholeRange.MinValue = "Camera";
diagram.AxisX.WholeRange.MaxValue = "Flash";
// or use the SetMinMaxValues method to specify range limits.
diagram.AxisX.WholeRange.SetMinMaxValues("Camera", "Flash");
Maximum and minimum range values are represented by double type values for Qualitative, DateTime, and TimeSpan axes (see the Range.MinValueInternal and Range.MaxValueInternal properties). You can use these internal values to change the range when axis values are unknown.
Use the AxisBase.GetScaleValueFromInternal(System.Double) method to convert an internal numerical value to an equivalent value for a DateTime, TimeSpan or Qualitative axis.
The following example demonstrates how to show the first five bars when you use a qualitative axis and the fifth argument value is unknown.
XYDiagram diagram = (XYDiagram)WebChartControl1.Diagram;
diagram.AxisX.WholeRange.MinValue = diagram.AxisX.GetScaleValueFromInternal(0);
diagram.AxisX.WholeRange.MaxValue = diagram.AxisX.GetScaleValueFromInternal(4);
Specify Diagram Side Margins
The Chart Control adds margins between the outermost series points and the diagram’s edges. To specify margins, use the WholeRange.StartSideMargin, WholeRange.EndSideMargin or WholeRange.SideMarginsValue properties.
The SideMarginSizeUnit property defines margin measurement units. When SideMarginSizeUnit is set to SideMarginSizeUnit.AxisUnit (the default value), margins are specified in axis measurement units.
| Property Value | Example |
|---|---|
| WholeRange.SideMarginsValue = 20 (days) |  |
| WholeRange.SideMarginsValue = 0 | |
XYDiagram diagram = (XYDiagram)WebChartControl1.Diagram;
diagram.AxisX.WholeRange.SideMarginsValue = 0;
Set Range.SideMarginSizeUnit to SideMarginSizeUnit.AxisRangePercentage to define margins as a percentage of the axis range.
This example shows how to set the left margin as a percentage:

XYDiagram diagram = (XYDiagram)WebChartControl1.Diagram;
diagram.AxisX.WholeRange.SideMarginSizeUnit = SideMarginSizeUnit.AxisRangePercentage;
diagram.AxisX.WholeRange.StartSideMargin = 15;
If you specify the SideMarginsValue, StartSideMargin or EndSideMargin property, the Range.AutoSideMargins property is set to false.
Hide Zero Level on a Value Axis
The Chart Control can calculate the minimum y-axis value based on series data. To start the y-axis at the minimum series point value, disable the WholeRange.AlwaysShowZeroLevel property.
| Property Value | Example |
|---|---|
| AlwaysShowZeroLevel = false |  |
| AlwaysShowZeroLevel = true |  |
XYDiagram diagram = (XYDiagram)WebChartControl1.Diagram;
diagram.AxisY.WholeRange.AlwaysShowZeroLevel = false;
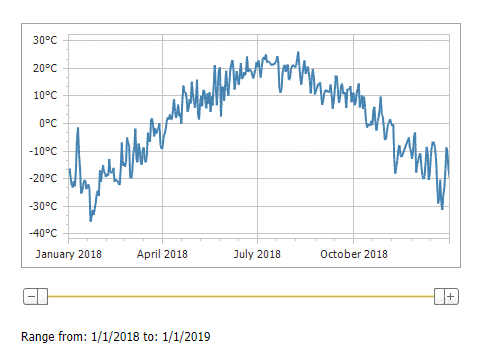
Manual Zooming
You can add a zoom bar that allows users to change the x-axis range. To do this, add ASPxTrackBar to a page and use WebChartControl’s callbacks to pass new ranges to the server and apply them to the chart.
ASPxTrackBar does not support date-time axes (see ASPxTrackBar.ValueType). To use the ASPxTrackBar to handle date-time values, create custom track bar items with the ASPxTrackBar.Items collection.
Follow the steps below to change the chart range according to the track bar settings.
Handle the ASPxClientTrackBar.PositionChanging event to get new range limits.
Handle the ASPxClientTrackBar.TrackEnd event and use the ASPxClientWebChartControl.PerformCallback method to send new range limits to the server.
Handle the WebChartControl.CustomCallback event to apply new range limits with the Range.SetMinMaxValues method.
The following code demonstrates this approach:
var minValue;
var maxValue;
function onTrackEnd(s, e) {
  if (!chart.InCallback()) {
      chart.PerformCallback(minValue + "|" + maxValue);
  }
  e.processOnServer = false;
}
function onPositionChanging(s, e) {
  minValue = s.GetItemText(e.newPositionStart);
  maxValue = s.GetItemText(e.newPositionEnd);
  lblStart.SetText("from: " + minValue);
  lblEnd.SetText("to: " + maxValue);
}
protected void WebChartControl1_DataBound(object sender, EventArgs e) {
   if (!IsCallback) {
       WebChartControl chart = (WebChartControl)sender;
       XYDiagram diagram = (XYDiagram)chart.Diagram;
       DateTime dateMin = Convert.ToDateTime(diagram.AxisX.WholeRange.MinValue);
       DateTime dateMax = Convert.ToDateTime(diagram.AxisX.WholeRange.MaxValue);
       //...
       //Populate the ASPxTrackBar item collection.
       foreach (DateTime day in EachDay(dateMin, dateMax)) {
           TrackBarItem item = new TrackBarItem();
           item.Value = day;
           item.Text = day.ToShortDateString();
           item.ToolTip = day.ToShortDateString();
           ASPxTrackBar1.Items.Add(item);
       }
       //...
   }
}
protected void WebChartControl1_CustomCallback(object sender, CustomCallbackEventArgs e) {
   string[] param = e.Parameter.Split('|');
   WebChartControl chart = (WebChartControl)sender;
   XYDiagram diagram = (XYDiagram)chart.Diagram;
   //Specify a new range.
   diagram.AxisX.WholeRange.SetMinMaxValues(Convert.ToDateTime(param[0]), Convert.ToDateTime(param[1]));
}
var minValue;
var maxValue;
function onTrackEnd(s, e) {
if (!chart.InCallback()) {
    chart.PerformCallback(minValue + "|" + maxValue);
}
e.processOnServer = false;
}
function onPositionChanging(s, e) {
minValue = s.GetItemText(e.newPositionStart);
maxValue = s.GetItemText(e.newPositionEnd);
lblStart.SetText("from: " + minValue);
lblEnd.SetText("to: " + maxValue);
}
   <dx:WebChartControl ID="WebChartControl1" ClientInstanceName="chart"
                   runat="server" Height="245px" Width="440px"
                  OnDataBound="WebChartControl1_DataBound"
                   OnCustomCallback="WebChartControl1_CustomCallback">
      <SeriesSerializable>
          <dx:Series ArgumentDataMember="Date" ValueDataMembersSerializable="Temperature">
              <ViewSerializable>
                  <dx:LineSeriesView MarkerVisibility="False" Color="SteelBlue" LineStyle-Thickness="2" />
              </ViewSerializable>
          </dx:Series>
      </SeriesSerializable>
      <DiagramSerializable>
          <dx:XYDiagram>
              <AxisX>
                  <GridLines Visible="True"></GridLines>
                  <WholeRange AutoSideMargins="False" />
              </AxisX>
              <AxisY Title-Text="Temperature" Title-Visibility="False" VisibleInPanesSerializable="-1">
                  <Label TextPattern="{V}°C" />
              </AxisY>
          </dx:XYDiagram>
      </DiagramSerializable>
  </dx:WebChartControl>
  ...
  <dx:ASPxTrackBar ID="ASPxTrackBar1" ClientInstanceName="trackBar" runat="server"
                  ValueType="System.String" AllowRangeSelection="true" Width="440px">
      <ClientSideEvents TrackEnd="onTrackEnd" PositionChanging="onPositionChanging" />
  </dx:ASPxTrackBar>
  <dx:ASPxLabel ID="ASPxLabel3" runat="server" Text="Range "></dx:ASPxLabel>
  <dx:ASPxLabel ID="ASPxLabel1" runat="server" ClientInstanceName="lblStart"></dx:ASPxLabel>
  <dx:ASPxLabel ID="ASPxLabel2" runat="server" ClientInstanceName="lblEnd"></dx:ASPxLabel>
protected void Page_Load(object sender, EventArgs e) {
    WebChartControl1.DataSource = LoadDataTableFromXml("CityWeather.xml", "CityWeather");
    WebChartControl1.DataBind();
}
public static DataTable LoadDataTableFromXml(string fileName, string tableName) {
    DataSet xmlDataSet = new DataSet();
    using (Stream xmlStream = File.OpenRead(HttpContext.Current.Server.MapPath("~/App_Data/" + fileName))) {
        xmlDataSet.ReadXml(xmlStream);
        xmlStream.Close();
    }
    return xmlDataSet.Tables[tableName];
}
//...
protected void WebChartControl1_DataBound(object sender, EventArgs e) {
    if (!IsCallback) {
        WebChartControl chart = (WebChartControl)sender;
        XYDiagram diagram = (XYDiagram)chart.Diagram;
        DateTime dateMin = Convert.ToDateTime(diagram.AxisX.WholeRange.MinValue);
        DateTime dateMax = Convert.ToDateTime(diagram.AxisX.WholeRange.MaxValue);
        ASPxLabel1.Text = string.Format("from:{0}", dateMin.ToShortDateString());
        ASPxLabel2.Text = string.Format("to:{0}", dateMax.ToShortDateString());
        //Populate the ASPxTrackBar item collection.
        foreach (DateTime day in EachDay(dateMin, dateMax)) {
            TrackBarItem item = new TrackBarItem();
            item.Value = day;
            item.Text = day.ToShortDateString();
            item.ToolTip = day.ToShortDateString();
            ASPxTrackBar1.Items.Add(item);
        }
        ASPxTrackBar1.PositionEnd = ASPxTrackBar1.Items.Count - 1;
    }
}
public IEnumerable<DateTime> EachDay(DateTime from, DateTime thru) {
    for (var day = from.Date; day.Date <= thru.Date; day = day.AddDays(1))
        yield return day;
}
protected void WebChartControl1_CustomCallback(object sender, CustomCallbackEventArgs e) {
    string[] param = e.Parameter.Split('|');
    WebChartControl chart = (WebChartControl)sender;
    XYDiagram diagram = (XYDiagram)chart.Diagram;
    //Specify a new range.
    diagram.AxisX.WholeRange.SetMinMaxValues(Convert.ToDateTime(param[0]), Convert.ToDateTime(param[1]));
}