Series Point Colorizer
- 3 minutes to read
This topic introduces the Chart Colorizer, lists colorizer types, and explains how to create a colorizer and customize its settings in a chart control.
The topic consists of the following sections.
Overview
The Colorizer is used to automatically choose colors for chart series points. This feature can be applied to the SeriesPoint class. Use the SeriesPoint.Color property to access the calculated colors.
Colorizers allow you to use colors to display additional information about the data.
Before using this feature, perform the following steps.
Specify the Series.DataSource property and all data member properties required to build a chart.
You can use colorizers to apply colors to series points based on the data source values. Available colorizers are listed below (see Step 3).

Use the SeriesBase.ColorDataMember property to specify the data member that stores color values.

Determine the colorizer type to be used in the application.
Currently, the following types are supported.
- ColorObjectColorizer applies ColorDataMember values to the SeriesPoint.Color property (if these values have the Color type or a type that can be converted to a color, such as an integer or a string).
- KeyColorColorizer applies a color based on color data member values used as key values. Series points with equal keys have the same color.
- RangeColorizer paints points based on the range to which color data member values belong.
After you select a colorizer type, assign an object of the selected type to the SeriesViewBase.Colorizer property. Then, you can customize the colorizer’s settings as described in the sections below.
Color Object Colorizer
The ColorObjectColorizer applies a color to a series point that is stored in the defined data field associated with the point. Use the ColorDataMember property to specify the data field name. This data field can store colors in different formats:
- An integer ARGB color value (431493885)
- Three or six digit hex code (#fc0, #ff005d)
- A string color name (SkyBlue)
- A Color object
Key-Color Colorizer
To configure the key-color colorizer, perform the following steps.
Fill the KeyColorColorizer.Keys collection.

Specify the ChartPaletteColorizerBase.PaletteName property if you want to use a non-default palette to colorize your data.

In addition, you can specify the KeyColorColorizer.KeyProvider property to change the way keys are selected based on the color data source member.
Note
This property can be changed only in code.
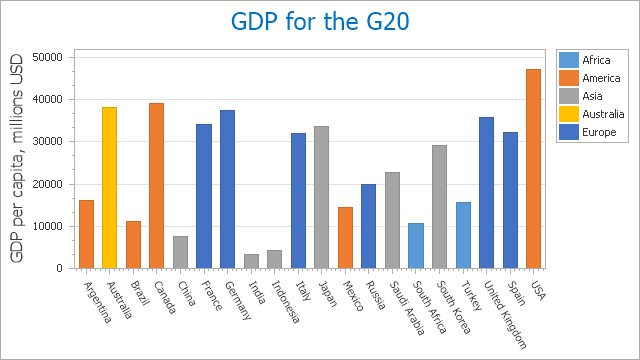
The following image uses the key-color colorizer to colorize each bar based on a country’s region (Africa, America, Asia, etc.).
Range Colorizer
To configure the range colorizer, perform the following steps.
Fill the RangeColorizer.RangeStops collection. These values form ranges that are used to determine the color a series point.

If you wish to use a custom palette to colorize your data, specify the ChartPaletteColorizerBase.Palette property.


In addition, you can set the RangeColorizer.ValueProvider property to specify numeric values that the RangeColorizer uses to determine point colors.
Note
This property can be changed only in code.
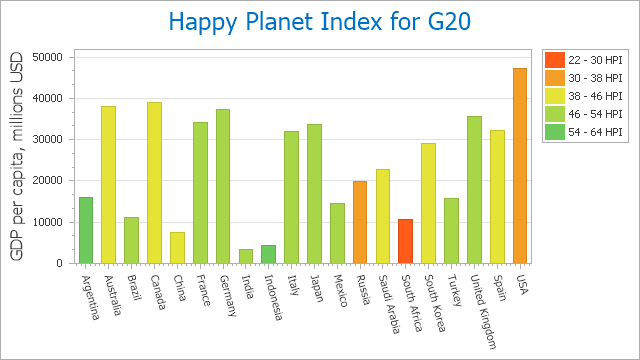
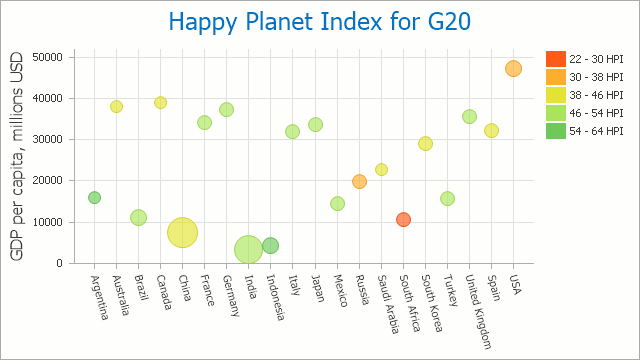
The following image uses the range colorizer to apply a color to each bar based on the Happy Planet Index.