Empty Points
- 6 minutes to read
Empty points are points with undefined Values. This document describes how the Chart Control processes empty points.
The Chart displays empty points as breaks in the Line or Area series views, and missing points or bars in other series view types.
](/WindowsForms/images/chart-control/empty-points-line.png?v=19.1)
](/WindowsForms/images/chart-control/empty-points-spline-area.png?v=19.1)
](/WindowsForms/images/chart-control/empty-points-stepline3d.png?v=19.1)
](/WindowsForms/images/chart-control/empty-points-bars.png?v=19.1)
](/WindowsForms/images/chart-control/empty-points-points.png?v=19.1)
The following table contains data for the charts above:
| Date | Politics | Entertainment | Travel |
|---|---|---|---|
| 01-Nov-16 | 65 | 56 | 45 |
| 02-Nov-16 | 78 | 45 | 40 |
| 03-Nov-16 | 95 | 70 | 56 |
| 04-Nov-16 | 110 | 82 | 47 |
| 05-Nov-16 | 108 | 80 | 38 |
| 06-Nov-16 | 52 | 20 | 31 |
| 07-Nov-16 | 46 | 10 | 27 |
| 08-Nov-16 | 70 | 27 | |
| 09-Nov-16 | 86 | 42 | |
| 10-Nov-16 | 92 | 65 | |
| 11-Nov-16 | 108 | 45 | 37 |
| 12-Nov-16 | 115 | 56 | 21 |
| 13-Nov-16 | 75 | 10 | 10 |
| 14-Nov-16 | 65 | 0 | 5 |
Note
19.1 Demo Center: Launch the Empty Points demo
To make a point empty, do one of the following:
leave a point’s value blank if you use the Chart Designer to add points to a series.
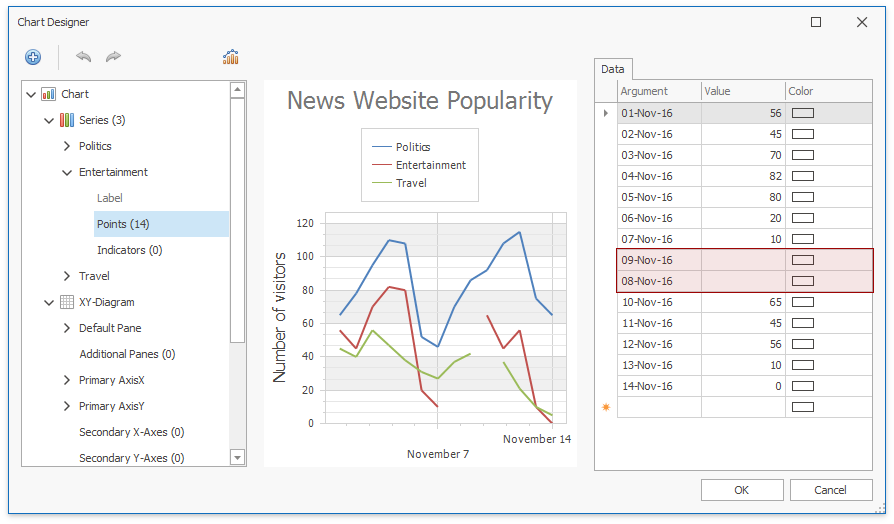
use the SeriesPoint‘s class constructors that take only an argument as a parameter if you add points to a series in code.
using DevExpress.XtraCharts; using System; using System.Collections.Generic; using System.Windows.Forms; namespace EmptyPointRepsentation { public partial class Form1 : Form { ChartControl chart { get { return chartControl1; } } public Form1() { InitializeComponent(); Series series = new Series(); // The following line adds an empty series point to a series. series.Points.Add(new SeriesPoint(new DateTime(2019,1,1))); chart.Series.Add(series); } } }or set a data point’s value to Double.NaN in a data source.
using DevExpress.XtraCharts;
using System;
using System.Collections.Generic;
using System.Windows.Forms;

namespace EmptyPointRepsentation {
    public partial class Form1 : Form {
        ChartControl chart { get { return chartControl1; } }
        public Form1() {
            InitializeComponent();
        }
        private void OnFormLoad(object sender, EventArgs e) {
            chart.DataSource = DataPoint.GetPoints();
            Series series1 = new Series("Politics", ViewType.Line);
            series1.SetDataMembers("Date", "Politics");
            Series series2 = new Series("Entertainment", ViewType.Line);
            series2.SetDataMembers("Date", "Entertainment");
            Series series3 = new Series("Travel", ViewType.Line);
            series3.SetDataMembers("Date", "Travel");
            chart.Series.AddRange(new Series[] { series1, series2, series3 });
        }
    }
    public class DataPoint {
        public DateTime Date { get; set; }
        public Double Politics { get; set; }
        public Double Entertainment { get; set; }
        public Double Travel { get; set; }
        public static List<DataPoint> GetPoints() {
            return new List<DataPoint> {
                    new DataPoint { Date = new DateTime(2016,11,1), Politics = 65,   Entertainment = 56, Travel = 45 },
                    new DataPoint { Date = new DateTime(2016,11,2), Politics = 78,   Entertainment = 45, Travel = 40 },
                    new DataPoint { Date = new DateTime(2016,11,3), Politics = 95,   Entertainment = 70, Travel = 56 },
                    new DataPoint { Date = new DateTime(2016,11,4), Politics = 110,  Entertainment = 82, Travel = 47 },
                    new DataPoint { Date = new DateTime(2016,11,5), Politics = 108,  Entertainment = 80, Travel = 38 },
                    new DataPoint { Date = new DateTime(2016,11,6), Politics = 52,   Entertainment = 20, Travel = 31 },
                    new DataPoint { Date = new DateTime(2016,11,7), Politics = 46,   Entertainment = 10, Travel = 27 },
                    new DataPoint { Date = new DateTime(2016,11,8), Politics = 70,   Entertainment = Double.NaN, Travel = 27 },
                    new DataPoint { Date = new DateTime(2016,11,9), Politics = 86,   Entertainment = Double.NaN, Travel = 42 },
                    new DataPoint { Date = new DateTime(2016,11,10), Politics = 92,  Entertainment = 65, Travel = Double.NaN},
                    new DataPoint { Date = new DateTime(2016,11,11), Politics = 105, Entertainment = 45, Travel = 37 },
                    new DataPoint { Date = new DateTime(2016,11,12), Politics = 115, Entertainment = 56, Travel = 21 },
                    new DataPoint { Date = new DateTime(2016,11,13), Politics = 75,  Entertainment = 10, Travel = 10 },
                    new DataPoint { Date = new DateTime(2016,11,14), Politics = 65,  Entertainment = 0 , Travel = 5  }
                };
        }
    }
}
You can use the SeriesPoint.IsEmpty property to check whether a point is empty.
Missing points are represented as empty points if the ScaleOptionsBase.ProcessMissingPoints property is set to InsertEmptyPoints.
Tip
- You can use scale breaks to hide specific data ranges from an axis.
- To limit data displayed in a chart, configure visual and whole axis ranges.
- If you use an argument axis with a date-time scale, you can exclude holidays, weekends or particular hours from a scale. Refer to Work Time and Workday Configuration for more information.
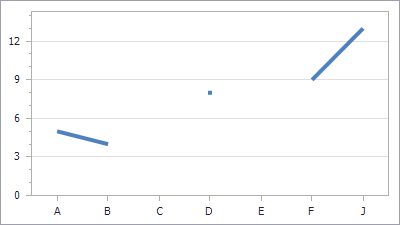
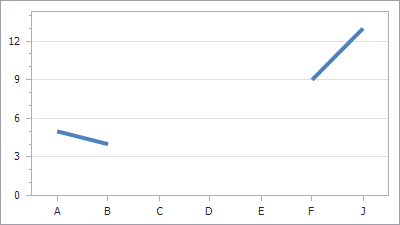
Show Isolated Points
The Chart does not draw a point between two empty points. To display a point in this case, enable the ShowIsolatedPoints property.
| ShowIsolatedPoints = true | ShowIsolatedPoints = false |
|---|---|
 |
 |