Using The Top-N Feature
- 3 minutes to read
This document describes how you can aggregate a number of series points into a single point.
The topic consists of the following sections.
Top-N Feature Overview
WinForms Charts support the Top-N feature, which allows you to get rid of series points with negligibly small values by either aggregating them into a single cumulative point, or by excluding them from the chart. Note that this does not affect the series points collection, and only has an effect on the chart’s visual representation.
In general, this cumulative point (when made visible) behaves like an ordinary point (e.g., it can be exploded and displayed in the Legend where it can be accompanied by custom text).
Note
The Top-N feature is only in effect for a series whose data points contain only one value, because this value is used to determine which points to show. Thus, the Top-N feature is not available for series whose view type implies more than one value (e.g., in a Stock or Bubble chart).
Note
If a series contains data points with negative values, their absolute values are taken into account when calculating which points should be visible within the chart.
Using the Top-N Feature
To enable the Top-N feature within the SeriesBase.TopNOptions property, set the TopNOptions.Enabled property to true. Then choose the criteria upon which points are gathered in the cumulative point from the TopNOptions.Mode property. The available modes are described below.
Count
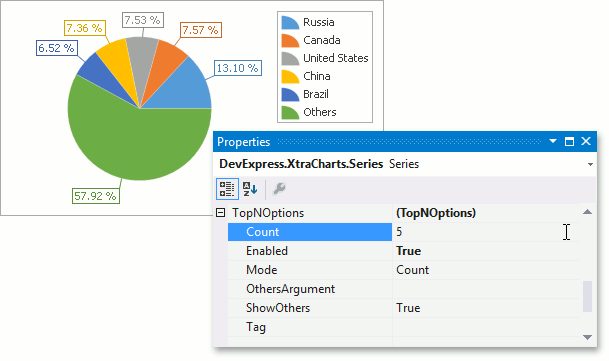
When this mode is specified, only the first N points within the collection remain visible, while others are aggregated in the cumulative point. The number of points not to be included is specified from the TopNOptions.Count property.
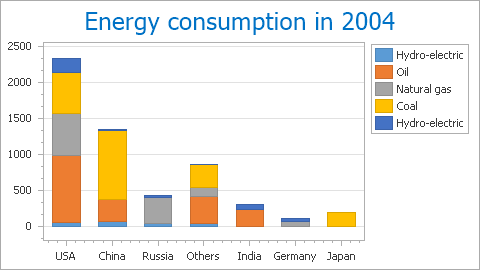
Note that with Bar, Line and Area Stacked Charts, values are displayed with stacking at shared series arguments, so the Top N points for multiple series (calculated independently for each series) can include points with the same arguments.
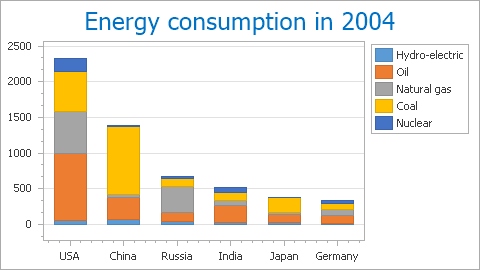
The table below shows how this works for a Stacked Bar Chart with each series TopNOptions.Count property set to 3. Excluding the “Others” cumulative point, 6 values (3 per series) are shown for 5 arguments.
Property values
Resulting image
TopNOptions.Enabled = false
TopNOptions.Enabled = true
TopNOptions.Count = 5
ThresholdValue
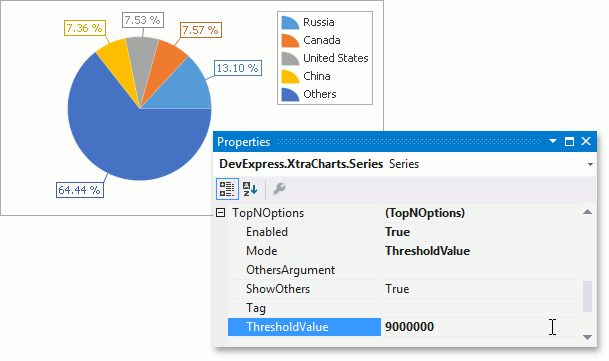
When this mode is specified, you should define the value threshold that points need to overcome so that they are not included in the cumulative point. This is done using the TopNOptions.ThresholdValue property.
ThresholdPercent
Similar to the previous mode, this parameter specifies the percentage threshold from the TopNOptions.ThresholdPercent property.
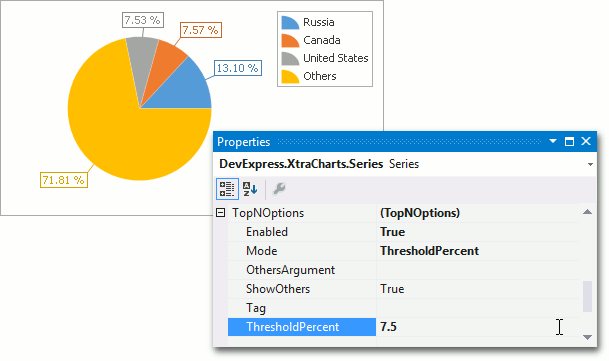
To choose whether or not the cumulative point should be visible, use the TopNOptions.ShowOthers property. Note that if values are represented as percentages (either in series point labels or in the legend), the overall percentage ignores the values of hidden points. The following image illustrates this.
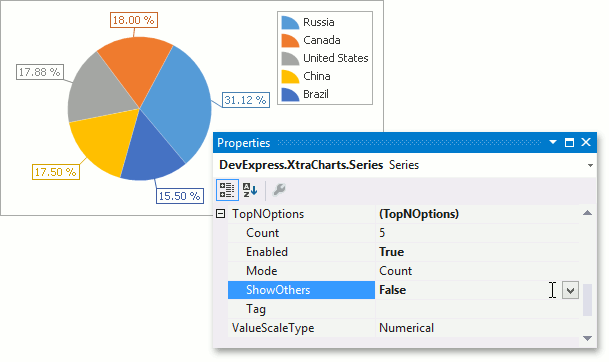
Note that when this property is set to true, the cumulative point is displayed in the legend, and if arguments are displayed in the legend, its default argument is Others. You can specify a custom argument from the TopNOptions.OthersArgument property. Note that this property setting also affects this point’s label.
To explode the cumulative point in a Pie or Doughnut chart, set the PieSeriesViewBase.ExplodeMode property to Others.