Data Aggregation
- 10 minutes to read
Data Aggregation groups raw data points into points with a larger argument measurement unit. For example, if data points’ arguments are measured in minutes, data aggregation can create points measured in hours or days to display fewer points.
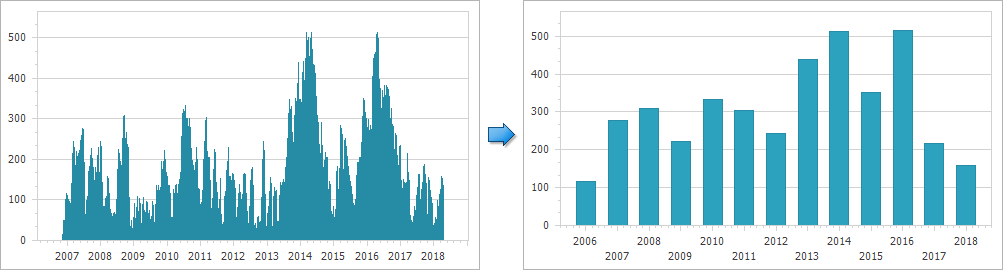
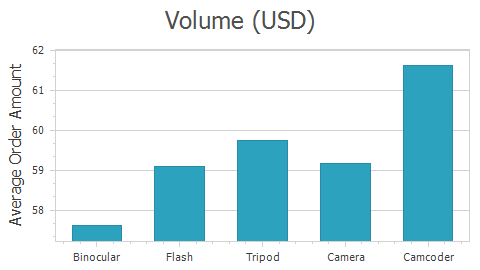
When the data aggregation is enabled, the X-axis splits its range into intervals and automatically aggregates data for each interval using the aggregate function. For example, the title image shows chart data aggregated by Years using the Average aggregate function.
Important
Data aggregation is available for the argument axis (X-axis) only.
Data aggregation is available depending on the X-Axis’s scale type and scale mode (ScaleOptionsBase.ScaleMode). The X-axis can use one of the following modes for date-time and numeric scales to aggregate data:
| Mode | Description |
|---|---|
| ScaleMode.Automatic | The chart control automatically defines the most optimal measurement unit for an axis based on the data set’s values, the Chart Control’s current size and zoom level. The ScaleGridOptionsBase.AggregateFunction property specifies the current aggregate function. |
| ScaleMode.Manual | The measurement unit is specified manually using the DateTimeScaleOptions.MeasureUnit and DateTimeScaleOptions.MeasureUnitMultiplier for the date time axis and NumericScaleOptions.MeasureUnit or NumericScaleOptions.CustomMeasureUnit for the numeric axis. |
| ScaleMode.Continuous | Data aggregation is disabled for numeric and date-time scales. This means an axis scale is not divided into intervals. |
Use the following code to specify the X-axis’s mode:
XYDiagram diagram = chartControl1.Diagram as XYDiagram;
// For qualitative data:
diagram.AxisX.QualitativeScaleOptions.AggregateFunction = AggregateFunction.Sum;
// For numeric data:
diagram.AxisX.NumericScaleOptions.ScaleMode = ScaleMode.Manual;
diagram.AxisX.NumericScaleOptions.MeasureUnit = DateTimeMeasureUnit.Thousands;
// For date-time data:
diagram.AxisX.DateTimeScaleOptions.ScaleMode = ScaleMode.Manual;
diagram.AxisX.DateTimeScaleOptions.MeasureUnit = DateTimeMeasureUnit.Minute;
diagram.AxisX.DateTimeScaleOptions.MeasureUnitMultiplier = 15;
The following properties and types configure the axis scale’s parameters:
| Property | Description |
|---|---|
| AxisXBase.QualitativeScaleOptions | Provides access to the options that define the behavior of a scale when its type is qualitative. |
| QualitativeScaleOptions | Contains settings for an axis scale when its data type is qualitative. |
| AxisBase.NumericScaleOptions | Stores the options that define the behavior of a scale when its type is numeric. |
| NumericScaleOptions | Contains settings for an axis scale when its data type is numeric. |
| AxisBase.DateTimeScaleOptions | Stores the options that define the behavior of a scale when its type is date-time. |
| DateTimeScaleOptions | Contains settings for an axis scale when its data type is date-time. |
The sections below detail the specifics of the aggregation feature using:
- Aggregate Function
- Qualitative Data Aggregation Specificity
- Numeric Data Aggregation Specificity
- Date-time Data Aggregation Specificity
Aggregate Function
The ScaleGridOptionsBase.AggregateFunction property (available in ScaleMode.Automatic and ScaleMode.Manual scale modes) specifies the function that aggregates data on each interval on the X-axis. The AggregateFunction enumeration lists all available aggregate functions and the AggregateFunction property uses the enumeration’s AggregateFunction.Average value by default.
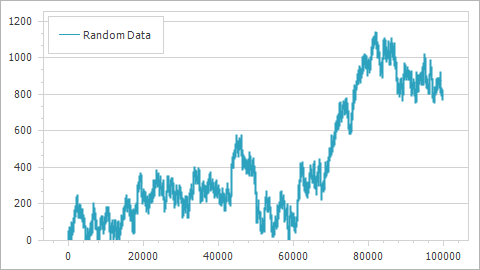
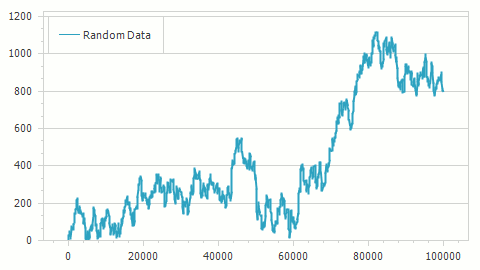
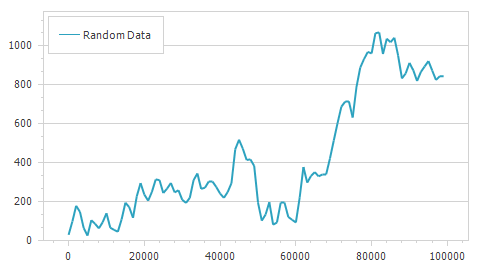
The following table shows data aggregated using the AggregateFunction.Minimum and AggregateFunction.Sum functions in the ScaleMode.Automatic scale mode.
| ScaleGridOptionsBase.AggregateFunction = AggregateFunction.Minimum | ScaleGridOptionsBase.AggregateFunction = AggregateFunction.Sum |
|---|---|
 |
 |
Set the CustomAggregateFunction class descendant object to the ScaleGridOptionsBase.CustomAggregateFunction property to use the custom aggregate function. Note that the ScaleGridOptionsBase.AggregateFunction property should be set to Custom.
Note
A complete sample project is available at https://github.com/DevExpress-Examples/how-to-implement-a-custom-aggregate-function-t625114
private void Form1_Load(object sender, EventArgs e) {
    Series series = chartControl.Series["Random Data"];
    series.DataSource = GenerateData(100_000);
    series.ArgumentDataMember = "Argument";
    series.ValueDataMembers.AddRange("Value", "Value", "Value", "Value");

    XYDiagram diagram = chartControl.Diagram as XYDiagram;
    diagram.AxisX.DateTimeScaleOptions.AggregateFunction = AggregateFunction.Custom;
    diagram.AxisX.DateTimeScaleOptions.CustomAggregateFunction = new OhlcAggregateFunction();
}

class OhlcAggregateFunction : CustomAggregateFunction {
    public override double[] Calculate(GroupInfo groupInfo) {
        double open = groupInfo.Values1.First();
        double close = groupInfo.Values1.Last();
        double high = Double.MinValue;
        double low = Double.MaxValue;
        foreach (double value in groupInfo.Values1) {
            if (high < value) high = value;
            if (low > value) low = value;
        }

        return new double[] { high, low, open, close };
    }
}
Use the ChartControl.AxisScaleChanged (WebChartControl.AxisScaleChanged) event to obtain the axis‘ automatically calculated grid alignment and measurement unit values, when the scale mode is automatic. Moreover the event arguments contains the axis itself. This event is raised when the scale mode, measure unit, grid alignment or grid spacing of the axis scale has been changed.
Note
A complete sample project is available at https://github.com/DevExpress-Examples/how-to-obtain-values-calculated-for-automatic-axis-date-time-scale-modes-e1529
private void Form1_Load(object sender, EventArgs e) {
    chartControl1.AxisScaleChanged += OnChartAxisScaleChanged;
}

private void OnChartAxisScaleChanged(object sender, AxisScaleChangedEventArgs e) {
    AxisX axisX = e.Axis as AxisX;
    if (axisX == null) return;
    // In this event, you can access the properties of the corresponding axis, and
    // obtain the automatically calculated value for the axis date-time grid alignment and measure unit.
    axisX.Title.Visibility = DefaultBoolean.True;
    axisX.Title.Text = String.Format(
        "The Axis Grid Alignment Unit is {0} \r\nThe Axis Measure Unit is {1}",
        e.Axis.DateTimeScaleOptions.GridAlignment.ToString(),
        e.Axis.DateTimeScaleOptions.MeasureUnit.ToString()
    );
}
When the Aggregate function is set to None, all series are grouped against point arguments and neither aggregate function is applied to data. This means that all points that have the same argument are displayed one over one. Set the ScaleOptionsBase.ScaleMode property to Continuous to disable aggregation.
Important
When a series uses a summary function, the X-axis can’t apply an aggregate function to data.
Qualitative Data Aggregation Specificity
The Chart Control aggregates qualitative data as follows: if several data rows have the same argument value, they are aggregated. The Chart Control does not aggregate qualitative data by default because the aggregate function is set to None. The following table contains the disabled and enabled aggregation samples:
| AxisX.QualitativeScaleOptions.AggregateFunction = AggregateFunction.None; | AxisX.QualitativeScaleOptions.AggregateFunction = AggregateFunction.Average; |
|---|---|
 |
 |
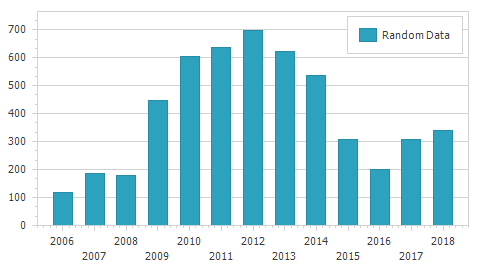
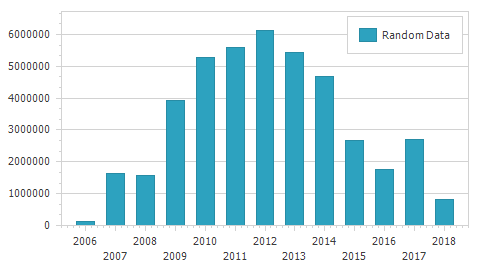
Numeric Data Aggregation Specificity
The Chart Control does not aggregate numeric data by default because the numeric scale mode is set to ScaleMode.Continuous:
The NumericMeasureUnit enumeration lists the values that the NumericScaleOptions.MeasureUnit property uses in the ScaleMode.Manual scale mode. The following table shows the difference between the predefined Hundreds and Thousands measurement units:
| NumericScaleOptions.MeasureUnit = NumericMeasureUnit.Hundreds | NumericScaleOptions.MeasureUnit = NumericMeasureUnit.Thousands |
|---|---|
 |
 |
If predefined measurement units are not applicable to the specified data source, use the NumericScaleOptions.CustomMeasureUnit property to specify a custom numeric measurement unit.
To use a custom Numeric measure unit for an Automatic scale mode, assign an object of a class implementing the INumericMeasureUnitsCalculator interface to the NumericScaleOptions.AutomaticMeasureUnitsCalculator property of AxisBase.NumericScaleOptions.
Note
A complete sample project is available at https://github.com/DevExpress-Examples/how-to-use-a-custom-numeric-measure-unit-in-automatic-scale-mode-t327427
    private void Form1_Load(object sender, EventArgs e) {
        chart.Series.Add(GenerateSeries(10000));

        XYDiagram diagram = chart.Diagram as XYDiagram;
        if (diagram == null) return;

        diagram.AxisX.NumericScaleOptions.AggregateFunction = AggregateFunction.Average;
        diagram.AxisX.NumericScaleOptions.ScaleMode = ScaleMode.Automatic;
        diagram.AxisX.NumericScaleOptions.AutomaticMeasureUnitsCalculator = new CustomNumericMeasureUnitCalculator();

        diagram.AxisY.WholeRange.AlwaysShowZeroLevel = false;
    }
class CustomNumericMeasureUnitCalculator : INumericMeasureUnitsCalculator {
    public double CalculateMeasureUnit(
            IEnumerable<Series> series,
            double axisLength,
            int pixelsPerUnit,
            double visualMin,
            double visualMax,
            double wholeMin,
            double wholeMax) {
        double visualRange = visualMax - visualMin;
        return Math.Ceiling(visualRange / 20);
    }
}
Date-time Data Aggregation Specificity
The X-axis’s data aggregation is enabled by default because the date-time ScaleOptionsBase.ScaleMode is set to ScaleMode.Manual. In this mode, the DateTimeScaleOptions.GridAlignment and DateTimeScaleOptions.MeasureUnit properties that define the Chart control’s grid appearance are available. The DateTimeScaleOptions.MeasureUnit also configures default axis labels‘ text format:
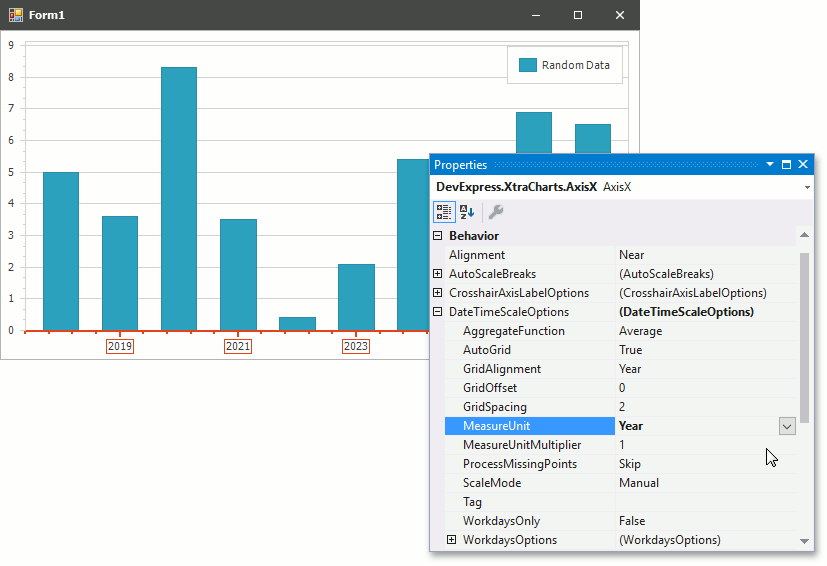
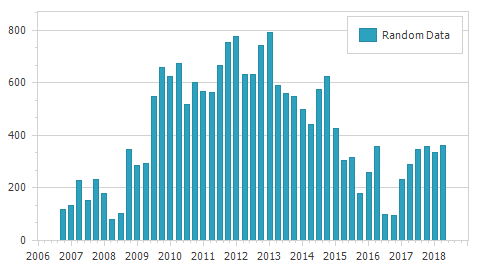
The DateTimeScaleOptions.MeasureUnit and DateTimeScaleOptions.MeasureUnitMultiplier properties determines the detail level for date-time values in the Manual scale mode. The DateTimeMeasurementUnit enumeration stores predefined measurement units. The following table shows data aggregated by DateTimeMeasurementUnit.Quarter and DateTimeMeasurementUnit.Year.
| DateTimeScaleOptions.MeasureUnit = DateTimeMeasurementUnit.Quarter | DateTimeScaleOptions.MeasureUnit = DateTimeMeasurementUnit.Year |
|---|---|
 |
 |
To use a custom Date-Time measure unit for an Automatic scale mode, assign an object of a class implementing the IDateTimeMeasureUnitsCalculator interface to the DateTimeScaleOptions.AutomaticMeasureUnitsCalculator property of AxisBase.DateTimeScaleOptions.
Note
A complete sample project is available at https://github.com/DevExpress-Examples/how-to-use-a-custom-date-time-measure-unit-in-automatic-scale-mode-t327370
    private void Form1_Load(object sender, EventArgs e) {
        chart.Series.Add(GenerateSeries(10000));

        XYDiagram diagram = chart.Diagram as XYDiagram;
        if (diagram == null) return;

        diagram.AxisX.DateTimeScaleOptions.AggregateFunction = AggregateFunction.Average;
        diagram.AxisX.DateTimeScaleOptions.ScaleMode = ScaleMode.Automatic;
        diagram.AxisX.DateTimeScaleOptions.AutomaticMeasureUnitsCalculator = new CustomDateTimeMeasureUnitsCalculator();

        diagram.AxisY.WholeRange.AlwaysShowZeroLevel = false;
    }
class CustomDateTimeMeasureUnitsCalculator : IDateTimeMeasureUnitsCalculator {
    const int daysInWeek = 7;
    const int daysInMonth = 30;
    const int daysInQuarter = 4 * daysInMonth;
    const int daysInYear = 365;

    const int minCount = 5;

    public DateTimeMeasureUnit CalculateMeasureUnit(
            IEnumerable<Series> series,
            double axisLength,
            int pixelsPerUnit,
            double visualMin,
            double visualMax,
            double wholeMin,
            double wholeMax) {
        // Calculate visual range in msecs.
        double visualRange = visualMax - visualMin;
        TimeSpan ts = TimeSpan.FromMilliseconds(visualRange);
        if (ts.TotalDays >= 1.0d) {
            if (ts.TotalDays <= minCount * daysInWeek)
                return DateTimeMeasureUnit.Day;
            if (ts.TotalDays <= minCount * daysInMonth)
                return DateTimeMeasureUnit.Week;
            if (ts.TotalDays <= minCount * daysInQuarter)
                return DateTimeMeasureUnit.Month;
            if (ts.TotalDays <= minCount * daysInYear)
                return DateTimeMeasureUnit.Quarter;
            else
                return DateTimeMeasureUnit.Year;
        }
        else if (ts.TotalHours >= 20.0d)
            return DateTimeMeasureUnit.Hour;
        else if (ts.TotalMinutes >= 20.0d)
            return DateTimeMeasureUnit.Minute;
        else if (ts.TotalSeconds >= 20.0d)
            return DateTimeMeasureUnit.Second;
        else
            return DateTimeMeasureUnit.Millisecond;
    }
}