How to: Explode Points of a Pie Chart
- 3 minutes to read
This tutorial demonstrates ways in which Pie series points (visually represented as the pie’s slices) can be exploded (sliced out from the series circle). This functionality is also available for series of the Doughnut view type.
To begin, we need to create a simple unbound chart of the PieSeriesView type. For this example, we’ll use the chart created for the following tutorial: How to: Change the Display Format for Series Labels of a Pie Chart. It is shown in the following image.

Then, select the Pie series, and in the Properties window, expand its SeriesBase.View property, to access options specific for the Pie series. Among these options, locate the PieSeriesViewBase.ExplodeMode property, allowing you to choose from several modes where the exploded points are defined. These modes are briefly described below.
UsePoints
If you choose the PieExplodeMode.UsePoints mode, you should explicitly determine which points to explode, via the PieSeriesViewBase.ExplodedPoints property. So, click the ellipsis button of this property, and in the invoked dialog, check the series points to be exploded, and click Close.
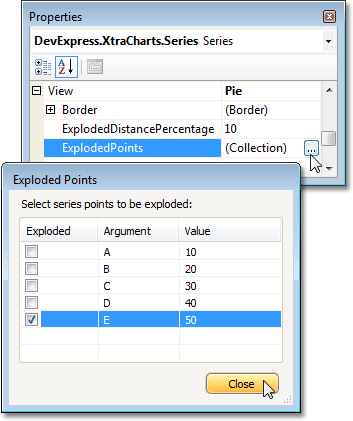
The result is shown in the following image.

UseFilters
When you select the PieExplodeMode.UseFilters mode, the PieSeriesViewBase.ExplodedPointsFilters property becomes available. Click its ellipsis button, and in the invoked dialog, create a new filtering criteria, and define its properties.
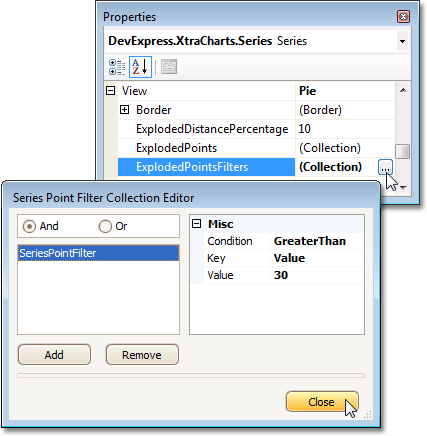
For example, to explode points whose values are greater than 30, set the SeriesPointFilter.Condition property to GreaterThan, SeriesPointFilter.Key - to Value, and SeriesPointFilter.Value - to 30. The result is shown in the following image.

MinValue and MaxValue
The PieExplodeMode.MinValue and PieExplodeMode.MaxValue modes determine the minimum or maximum values of the series points to be exploded.. The following images demonstrate these settings in action.
| PieExplodeMode = MinValue | PieExplodeMode = MaxValue |
|---|---|
 |
|
All and None
Finally, you can explode all the series points, by choosing the PieExplodeMode.All mode, or none of them - by choosing the PieExplodeMode.None mode. The following images demonstrate these settings in action.
| PieExplodeMode = All | PieExplodeMode = None |
|---|---|
 |
|
Others
The special PieExplodeMode.Others mode should be applied when the “TopN” feature is enabled, to explode the points aggregated under the “Others” argument. The image below demonstrates this mode in a chart created for the following tutorial: How to: Show N Top Points as a Single Section in a Pie Chart.

In addition, use the PieSeriesViewBase.ExplodedDistancePercentage property, to define the distance at which the exploded points are sliced out.
To allow your end users interactively explode the required series points at runtime, enable the PieSeriesView.RuntimeExploding property.