Lesson 1 - Create a Simple Chart
- 5 minutes to read
This lesson demonstrates how to create a simple chart with two Side-by-Side Bar series, populate it with data, and adjust its common settings.
Note
You can also create a chart using the Instant Layout Assistant. For more details, see the How to: Create a Chart Using the Instant Layout Assistant (for VS 2015 and earlier) example.
To create a simple charting application, do the following.
- Step 1. Create a New Project and Add a Chart Control
- Step 2. Provide Chart Data
- Step 3. Customize the Chart
- Result
Step 1. Create a New Project and Add a Chart Control
- Run Microsoft Visual Studio 2012, 2013, 2015 or 2017.
- Create a new WPF Application project.
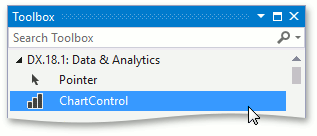
Add the ChartControl object to your project. You can do this by dragging the ChartControl item from the DX.18.2: Data & Analytics Toolbox tab.
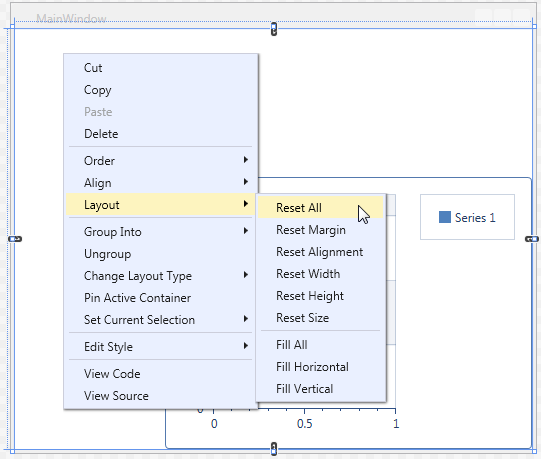
Right-click the ChartControl object and choose Layout | Reset All in the context menu. This will stretch the chart to fill the entire window.
After this action, your XAML appears as follows. If it does not, overwrite your code with the code below.
<Window xmlns="http://schemas.microsoft.com/winfx/2006/xaml/presentation"
        xmlns:x="http://schemas.microsoft.com/winfx/2006/xaml"
        xmlns:dxc="http://schemas.devexpress.com/winfx/2008/xaml/charts"
        x:Class="WPFCharts_Lesson1.MainWindow"
        Title="MainWindow" Height="503.731" Width="687.687">
    <Grid>
        <dxc:ChartControl>
            <dxc:ChartControl.Legends>
                <dxc:Legend/>
            </dxc:ChartControl.Legends>
            <dxc:XYDiagram2D>
                <dxc:BarSideBySideSeries2D DisplayName="Series 1"/>
            </dxc:XYDiagram2D>
        </dxc:ChartControl>
    </Grid>
</Window>
Note
You can add the ChartControl with the XYDiagram2D diagram type and the Side-by-Side Bar series, and add a Legends to the chart by overwriting your MainWindow.xaml file with this code, without dragging the ChartControl to the window.
If the auto-created XAML does not meet your requirements, you can leave the ChartControl object in XAML, as shown below, and create chart elements manually (for example, add another diagram type to the chart using the ChartControl.Diagram property).
<Window xmlns="http://schemas.microsoft.com/winfx/2006/xaml/presentation"
        xmlns:x="http://schemas.microsoft.com/winfx/2006/xaml"
        xmlns:dxc="http://schemas.devexpress.com/winfx/2008/xaml/charts"
        x:Class="WPFCharts_Lesson1.MainWindow"
        Title="MainWindow" Height="503.731" Width="687.687">
    <Grid>
        <dxc:ChartControl>
        </dxc:ChartControl>
    </Grid>
</Window>
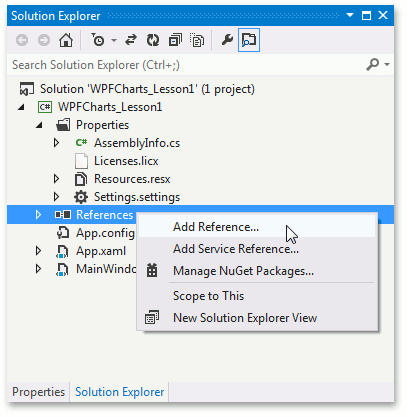
However, in this case, you need to manually add references to the following libraries:
DevExpress.Data.v18.2, DevExpress.Xpf.Core.v18.2, DevExpress.Charts.v18.2.Core, DevExpress.Xpf.Charts.v18.2, DevExpress.Mvvm.v18.2, DevExpress.Xpf.Printing.v18.2 and DevExpress.Printing.v18.2.Core.
Note
Normally, references added to these assemblies are chosen from the Global Assembly Cache (GAC). However, if you prefer to copy them locally, or need to include them later into your product’s installation, you can find copies in the following directory: C:\Program Files (x86)\DevExpress 18.2\Components\Bin\Framework\.
In this step, leave the auto-created XAML as is.
In the next step, you will add the second Side-by-Side Bar series to the chart and populate the series points with data.
Step 2. Provide Chart Data
You will need to fill the chart with data. Start by adding the second Side-by-Side Bar series to the auto-created Diagram2D diagram type.
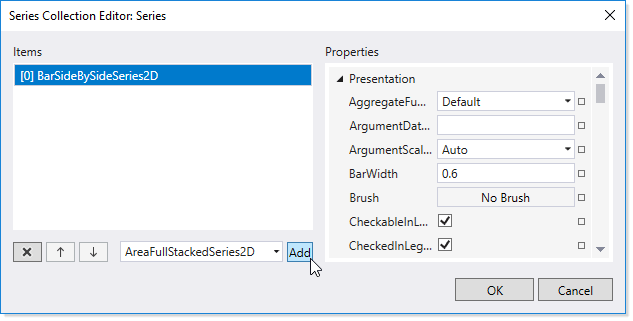
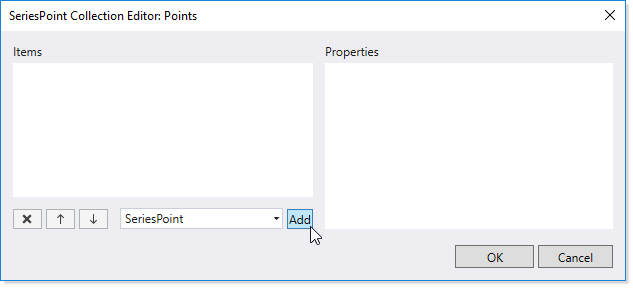
Locate the Diagram.Series property and click the ellipsis button to invoke the Collection Editor: Series. In this editor, add the second BarSideBySideSeries2D by clicking the Add button.
For each series, locate the Series.Points property and add 4 SeriesPoint objects to them using the Add button.
For each series point, set the argument and value as follows.
SeriesPoint Argument Value [0] A 1 [1] B 2 [2] C 3 [3] D 4 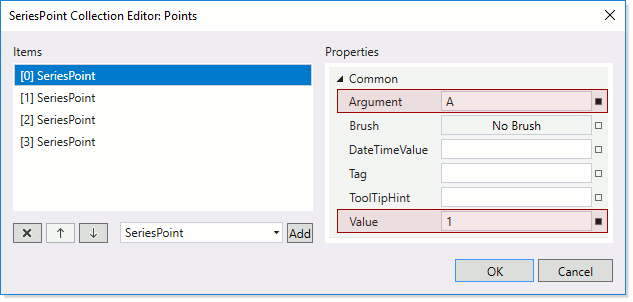
Do the same for the second series with the following values.
SeriesPoint Argument Value [0] A 4 [1] B 3 [2] C 2 [3] D 1
After these actions are complete, you will get the following XAML.
<Window xmlns="http://schemas.microsoft.com/winfx/2006/xaml/presentation"
        xmlns:x="http://schemas.microsoft.com/winfx/2006/xaml"
        xmlns:dxc="http://schemas.devexpress.com/winfx/2008/xaml/charts"
        x:Class="WPFCharts_Lesson1.MainWindow"
        Title="MainWindow" Height="503.731" Width="687.687">
    <Grid>
        <dxc:ChartControl>
            <dxc:ChartControl.Legends>
                <dxc:Legend/>
            </dxc:ChartControl.Legends>
            <dxc:XYDiagram2D>
                <dxc:BarSideBySideSeries2D DisplayName="Series 1">
                    <dxc:SeriesPoint Argument="A" Value="1"/>
                    <dxc:SeriesPoint Argument="B" Value="2"/>
                    <dxc:SeriesPoint Argument="C" Value="3"/>
                    <dxc:SeriesPoint Argument="D" Value="4"/>
                </dxc:BarSideBySideSeries2D>
                <dxc:BarSideBySideSeries2D>
                    <dxc:SeriesPoint Argument="A" Value="4"/>
                    <dxc:SeriesPoint Argument="B" Value="3"/>
                    <dxc:SeriesPoint Argument="C" Value="2"/>
                    <dxc:SeriesPoint Argument="D" Value="1"/>
                </dxc:BarSideBySideSeries2D>
            </dxc:XYDiagram2D>
        </dxc:ChartControl>
    </Grid>
</Window>
Step 3. Customize the Chart
In the final step, you will learn how to customize the chart (adjust series-view-specific options, customize crosshair cursor options, etc.).
Adjust Series-view-specific Options
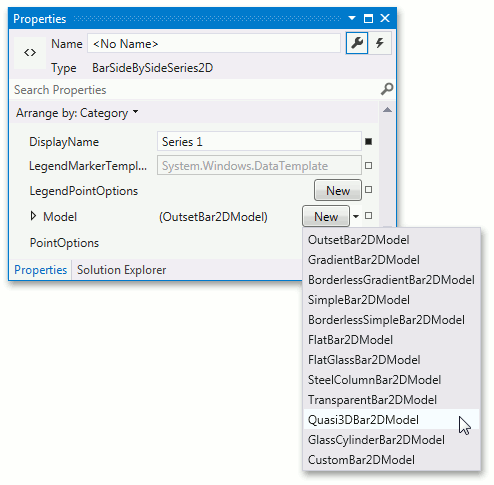
Next, you will make the chart appear 3D.
To do this, locate the BarSideBySideSeries2D object’s BarSeries2D.Model property and select Quasi3DBar2DModel from the drop-down list.
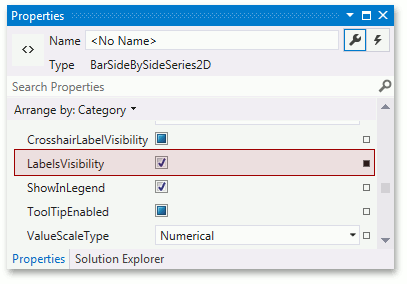
To display series labels, set the Series.LabelsVisibility property value to true, as shown in the image below.
- Repeat previous actions for the second series.
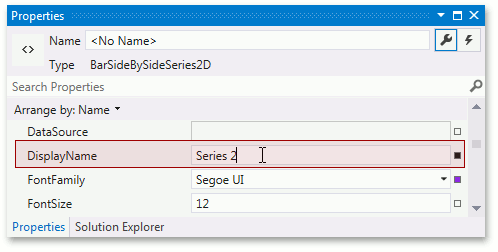
- Because the display name is specified automatically for the first series when you drop the ChartControl onto the form (see Steps 1-4. Create a New Project and Add a Chart Control), specify the display name for the second series.
To specify how a series is indicated in a legend, set the Series.DisplayName property of the first series to Series 2.
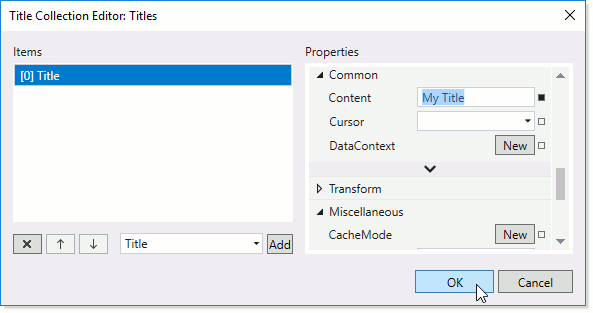
Add a Chart Title
- To create a title for your chart, select it, and in the Properties grid, click the ellipsis button for the ChartControlBase.Titles property.
In the invoked collection editor, click Add and set the TitleBase.Content to “My Title”.
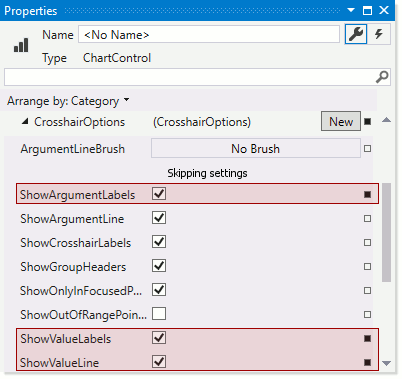
Customize Crosshair Cursor Options
Crosshair cursor labels and a crosshair argument line are displayed on a chart by default. You can disable (enable) a crosshair cursor at the chart level (using the ChartControlBase.CrosshairEnabled property) and at the series level (using the XYSeries2D.CrosshairEnabled property).
To show crosshair cursor value lines and crosshair cursor axis labels, set the CrosshairOptionsBase.ShowValueLine, CrosshairOptions.ShowArgumentLabels and CrosshairOptions.ShowValueLabels properties to true.
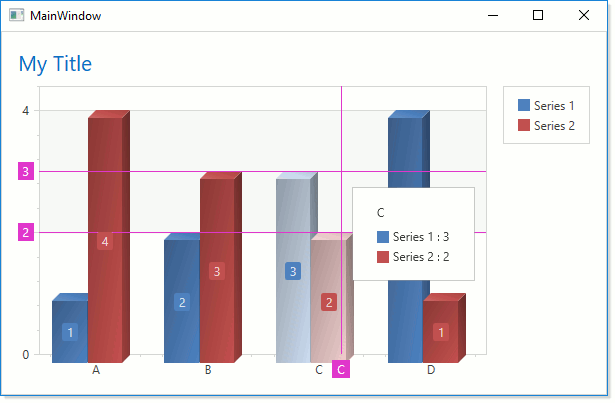
Result
After performing all of the steps above, your XAML should appear as follows.
<Window xmlns="http://schemas.microsoft.com/winfx/2006/xaml/presentation"
        xmlns:x="http://schemas.microsoft.com/winfx/2006/xaml"
        xmlns:dxc="http://schemas.devexpress.com/winfx/2008/xaml/charts"
        x:Class="WPFCharts_Lesson1.MainWindow"
        Title="MainWindow" Height="503.731" Width="687.687">
    <Grid>
        <dxc:ChartControl>
            <dxc:ChartControl.Titles>
                <dxc:Title Content="My Title"/>
            </dxc:ChartControl.Titles>
            <dxc:ChartControl.CrosshairOptions>
                <dxc:CrosshairOptions ShowArgumentLabels="True" ShowValueLabels="True" ShowValueLine="True"/>
            </dxc:ChartControl.CrosshairOptions>
            <dxc:ChartControl.Legends>
                <dxc:Legend/>
            </dxc:ChartControl.Legends>
            <dxc:XYDiagram2D>
                <dxc:BarSideBySideSeries2D DisplayName="Series 1" LabelsVisibility="True">
                    <dxc:BarSideBySideSeries2D.Model>
                        <dxc:Quasi3DBar2DModel/>
                    </dxc:BarSideBySideSeries2D.Model>
                    <dxc:SeriesPoint Argument="A" Value="1"/>
                    <dxc:SeriesPoint Argument="B" Value="2"/>
                    <dxc:SeriesPoint Argument="C" Value="3"/>
                    <dxc:SeriesPoint Argument="D" Value="4"/>
                </dxc:BarSideBySideSeries2D>
                <dxc:BarSideBySideSeries2D LabelsVisibility="True" DisplayName="Series 2">
                    <dxc:BarSideBySideSeries2D.Model>
                        <dxc:Quasi3DBar2DModel/>
                    </dxc:BarSideBySideSeries2D.Model>
                    <dxc:SeriesPoint Argument="A" Value="4"/>
                    <dxc:SeriesPoint Argument="B" Value="3"/>
                    <dxc:SeriesPoint Argument="C" Value="2"/>
                    <dxc:SeriesPoint Argument="D" Value="1"/>
                </dxc:BarSideBySideSeries2D>
            </dxc:XYDiagram2D>
        </dxc:ChartControl>
    </Grid>
</Window>
Run the project. The following image illustrates the resulting chart at runtime.
Tip
A complete sample project is available in the DevExpress Code Examples database at http://www.devexpress.com/example=E3154.