Lesson 3 - Bind Chart Series to Data
- 5 minutes to read
This lesson explains how to manually add a series to a chart’s diagram, and then bind this series to a datasource. If you wish to learn how to automatically generate a series from a datasource, proceed to Lesson 4 - Use a Series Template for Auto-Created Series.
Note that although the Microsoft Access database (.mdb) is used in this tutorial, the ChartControl can be bound to a variety of other data providers. For more information on data binding, refer to the Providing Data section.
To create a data-bound charting application, do the following.
- Step 1. Create a New Project and Add a Chart Control
- Step 2. Connect to a Datasource
- Step 3. Bind the Chart to a Datasource
- Step 4. Customize the Chart
- Result
Step 1. Create a New Project and Add a Chart Control
- Run MS Visual Studio 2012, 2013, 2015 or 2017.
- Create a new WPF Application project.
- Add the ChartControl component to your project, as you did in Lesson 1 (see step 1).
Step 2. Connect to a Datasource
In this step, you will bind the ChartControl to the CarsDB database. The chart will represent this table as bars.
To perform design-time data binding, the Items Source Configuration Wizard is used. To add a datasource to a WPF application, proceed with the following steps.
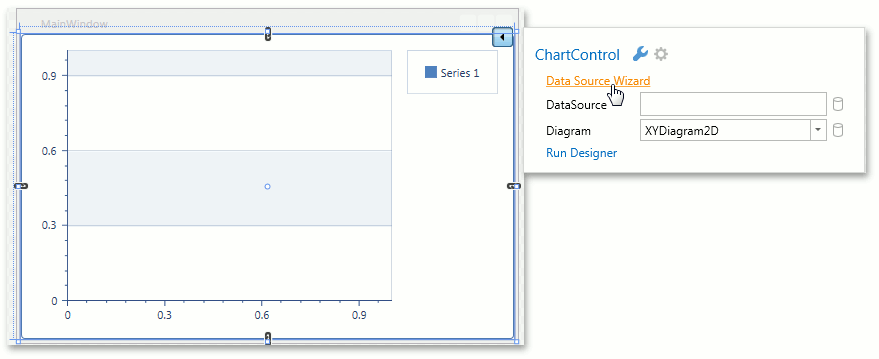
Locate the ChartControl in the form designer and click its smart-tag. Then, in the ChartControl actions list, click the Data Source Wizard to invoke the wizard.
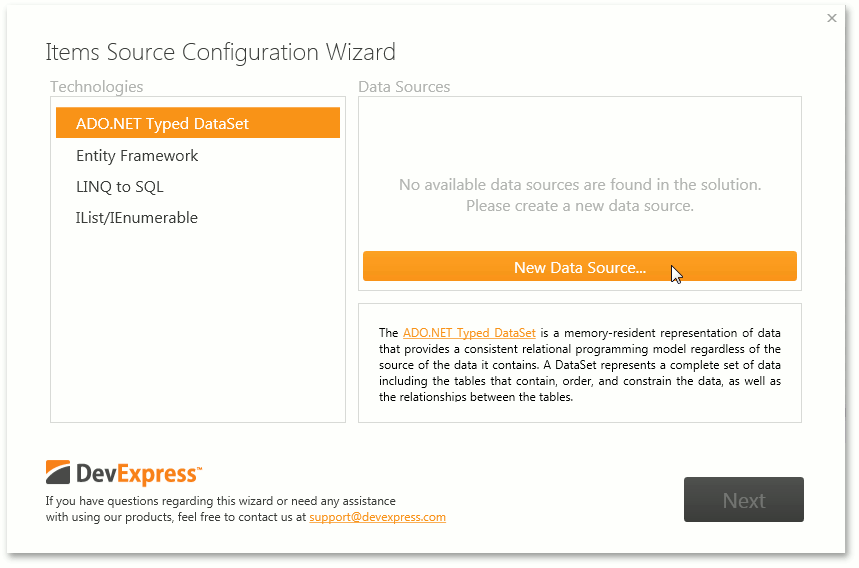
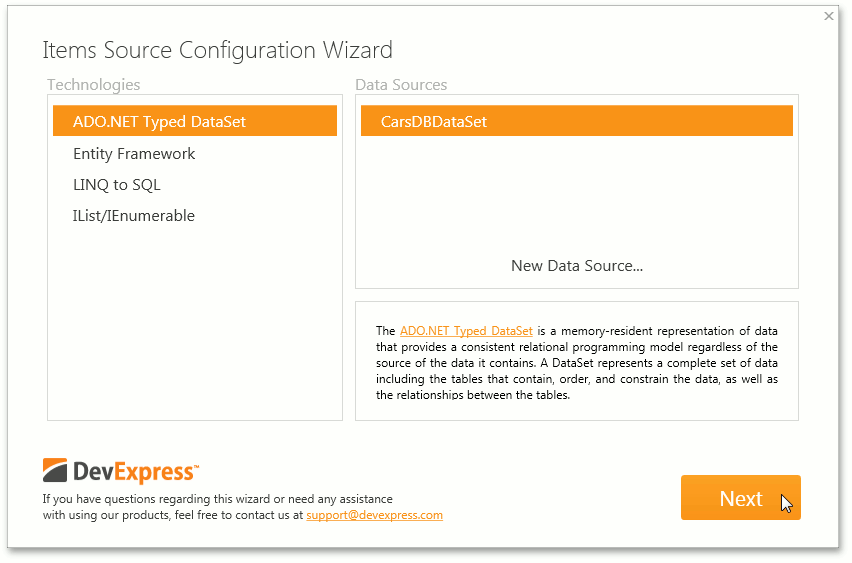
Select the ADO.NET Typed DataSet data technology and click the New Data Source… button.
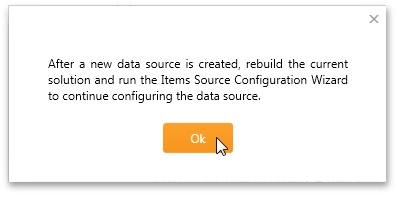
A message box that notifies you of the necessity to rebuild the solution and reopen the Items Source Configuration Wizard appears.
Click Ok to run the Data Source Configuration Wizard.
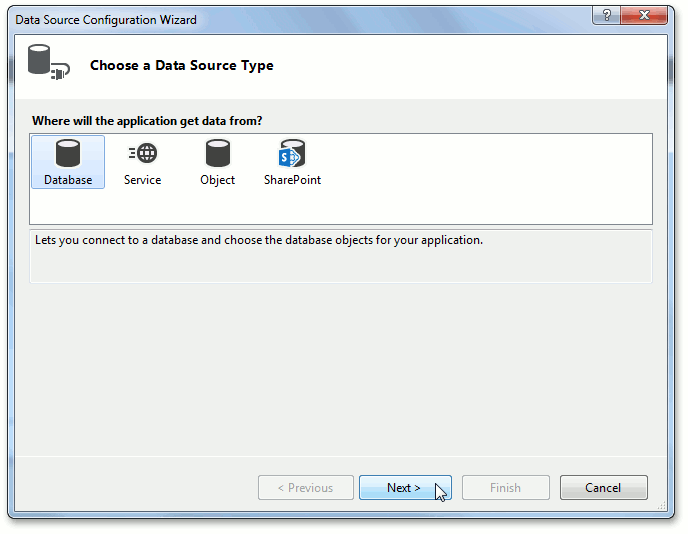
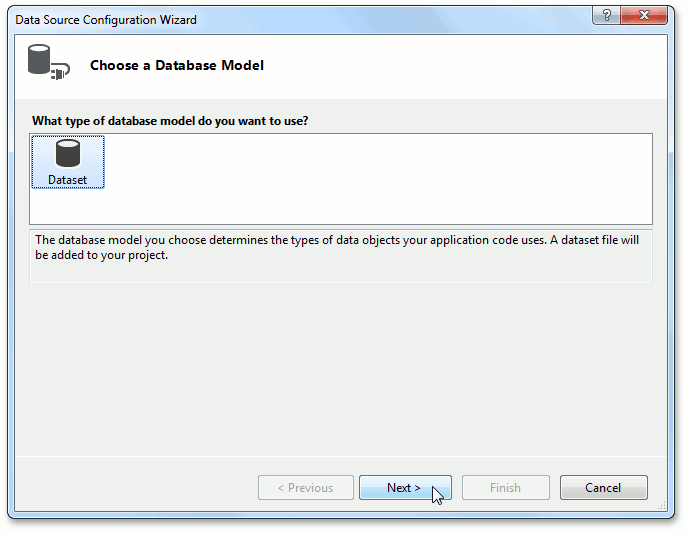
In the Data Source Configuration Wizard, leave the Database item as is and click Next.
In the next page, click Next.
On the Choose Your Data Connection page, click New Connection… to create a connection to a database.
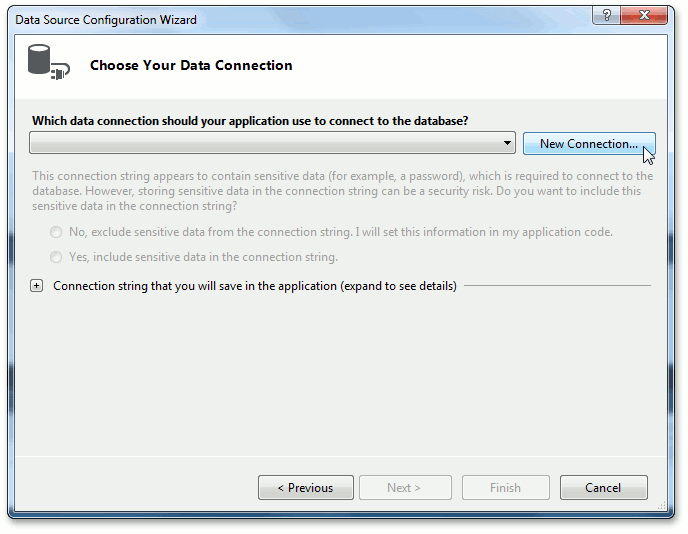
This invokes the Add Connection dialog.
Leave the Microsoft Access Database File as your data source. Then, click the Browse… button and specify the CarsDB.mdb database as your data connection. By default, it is stored in the following path.
C:\Users\Public\Documents\DevExpress Demos 18.2\Components\Data
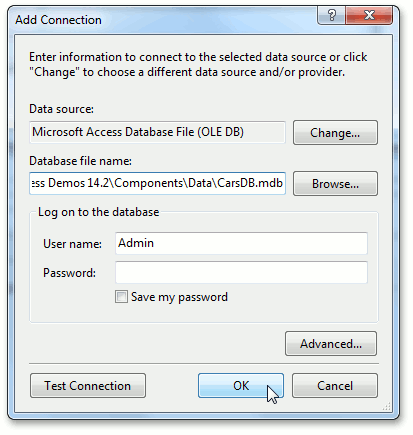
- Click OK to close the dialog and then click Next in the wizard.
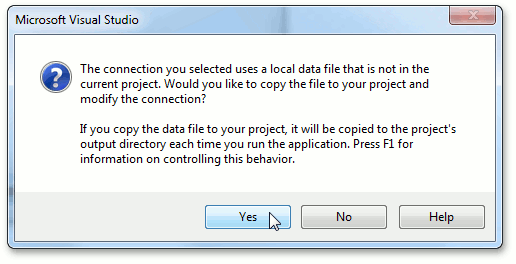
This invokes a message box that asks whether or not to copy the database file to the project and modify the connection. Click Yes, as shown below.
In the next wizard page, you can choose whether to save the connection settings to the application configuration file or not.
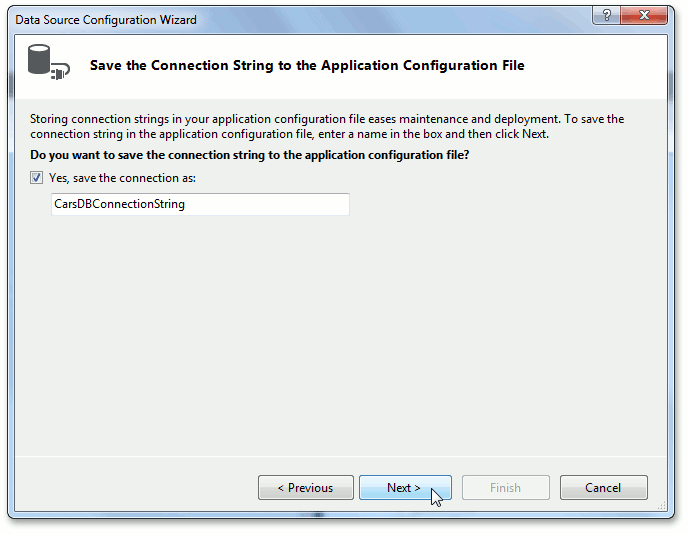
Make sure that the Yes, save the connection as: check box is checked and click Next.
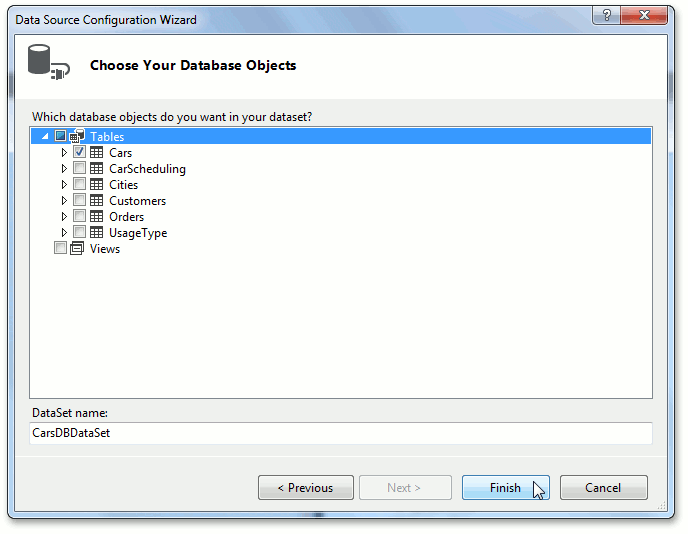
Expand the Tables list and select the Cars item. Then click Finish to close the Data Source Configuration Wizard.
Step 3. Bind the Chart to a Datasource
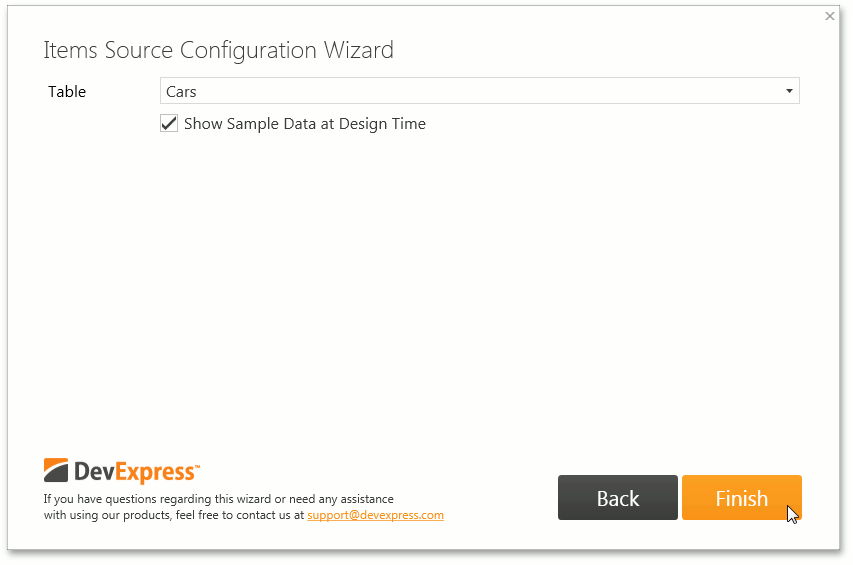
Rebuild the solution and open the Items Source Configuration Wizard, as you did in the previous step. The newly created data source will be displayed within the Data Sources section. Click Next.
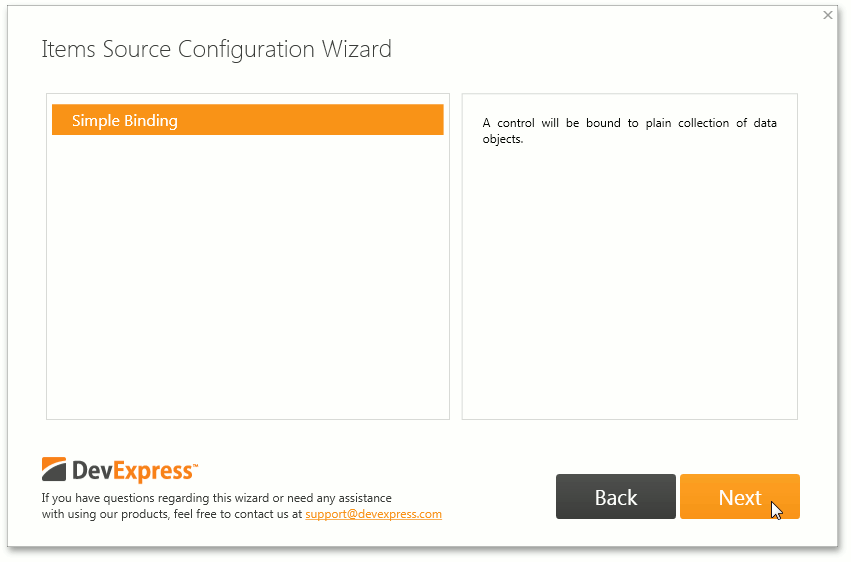
Leave Simple Binding to bind the control to a plain collection of data objects and click Next.
Leave the Cars table and click Finish.
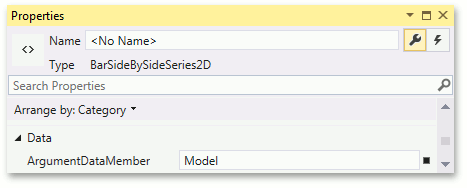
Specify the name of the data field that contains the series points’ argument. To do this, locate the Series.ArgumentDataMember property of the BarSideBySideSeries2D object in the Properties window and set it to Model.
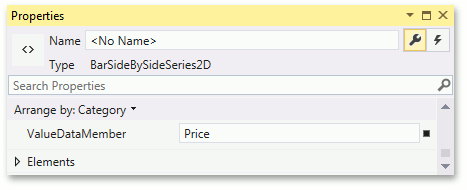
To define the bound datasource’s data field from which the series obtains the values of its points, set the BarSideBySideSeries2D‘s Series.ValueDataMember property to Price.
After performing this step, your XAML should look like this.
<Window
        xmlns="http://schemas.microsoft.com/winfx/2006/xaml/presentation"
        xmlns:x="http://schemas.microsoft.com/winfx/2006/xaml"
        xmlns:dx="http://schemas.devexpress.com/winfx/2008/xaml/core"
        xmlns:CarsDBDataSetTableAdapters="clr-namespace:Lesson3.CarsDBDataSetTableAdapters"
        xmlns:local="clr-namespace:Lesson3" xmlns:dxc="http://schemas.devexpress.com/winfx/2008/xaml/charts"
        x:Class="Lesson3.MainWindow"
        Title="MainWindow" Height="350" Width="525">
    <Window.Resources>
        <dx:TypedSimpleSource x:Key="TypedSimpleSource" AdapterType="{x:Type CarsDBDataSetTableAdapters:CarsTableAdapter}"
                              ContextType="{x:Type local:CarsDBDataSet}" Path="Cars">
            <dx:DesignDataManager.DesignData>
                <dx:DesignDataSettings RowCount="5"/>
            </dx:DesignDataManager.DesignData>
        </dx:TypedSimpleSource>
    </Window.Resources>

    <Grid>
        <dxc:ChartControl DataSource="{Binding Data, Source={StaticResource TypedSimpleSource}}">
            <dxc:ChartControl.Legend>
                <dxc:Legend/>
            </dxc:ChartControl.Legend>
            <dxc:XYDiagram2D>
                <dxc:BarSideBySideSeries2D DisplayName="Series 1"
                                           ArgumentDataMember="Model" ValueDataMember="Price"/>
            </dxc:XYDiagram2D>
        </dxc:ChartControl>
    </Grid>
</Window>
Step 4. Customize the Chart
Change the series name
To do this, set the Series.DisplayName property to Cars.
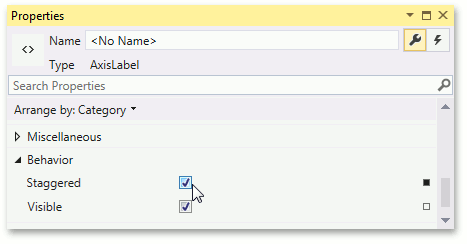
Adjust the axis labels
Locate the ChartControl‘s AxisLabel.Staggered property (the AxisLabel object is accessed via the AxisBase.Label property) and turn it on, so that the labels on the X axis do not overlap each other.
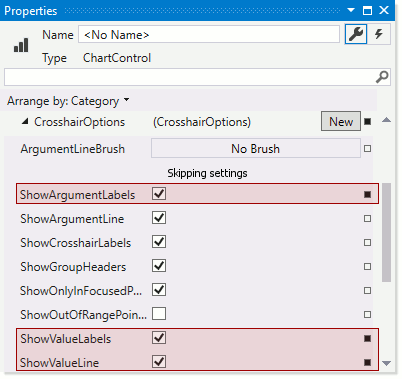
Adjust the crosshair cursor options
Crosshair cursor labels and the crosshair argument line are displayed on a chart by default. You can disable (enable) a crosshair cursor at the chart level (using the ChartControlBase.CrosshairEnabled property) and at the series level (using the XYSeries2D.CrosshairEnabled property).
To show crosshair cursor value lines and crosshair cursor axis labels, set the CrosshairOptionsBase.ShowValueLine, CrosshairOptions.ShowArgumentLabels and CrosshairOptions.ShowValueLabels properties to true.
Result
After performing all of the above steps, your XAML should appear as follows.
<Window
        xmlns="http://schemas.microsoft.com/winfx/2006/xaml/presentation"
        xmlns:x="http://schemas.microsoft.com/winfx/2006/xaml"
        xmlns:dx="http://schemas.devexpress.com/winfx/2008/xaml/core"
        xmlns:CarsDBDataSetTableAdapters="clr-namespace:Lesson3.CarsDBDataSetTableAdapters"
        xmlns:local="clr-namespace:Lesson3" xmlns:dxc="http://schemas.devexpress.com/winfx/2008/xaml/charts"
        x:Class="Lesson3.MainWindow"
        Title="MainWindow" Height="350" Width="525">
    <Window.Resources>
        <dx:TypedSimpleSource x:Key="TypedSimpleSource" AdapterType="{x:Type CarsDBDataSetTableAdapters:CarsTableAdapter}"
                              ContextType="{x:Type local:CarsDBDataSet}" Path="Cars">
            <dx:DesignDataManager.DesignData>
                <dx:DesignDataSettings RowCount="5"/>
            </dx:DesignDataManager.DesignData>
        </dx:TypedSimpleSource>
    </Window.Resources>

    <Grid>
        <dxc:ChartControl DataSource="{Binding Data, Source={StaticResource TypedSimpleSource}}">
            <dxc:ChartControl.CrosshairOptions>
                <dxc:CrosshairOptions ShowArgumentLabels="True" ShowValueLine="True" ShowValueLabels="True"/>
            </dxc:ChartControl.CrosshairOptions>
            <dxc:ChartControl.Legend>
                <dxc:Legend/>
            </dxc:ChartControl.Legend>
            <dxc:XYDiagram2D>
                <dxc:XYDiagram2D.AxisX>
                    <dxc:AxisX2D>
                        <dxc:AxisX2D.Label>
                            <dxc:AxisLabel Staggered="True"/>
                        </dxc:AxisX2D.Label>
                    </dxc:AxisX2D>
                </dxc:XYDiagram2D.AxisX>
                <dxc:BarSideBySideSeries2D DisplayName="Cars"
                                           ArgumentDataMember="Model" ValueDataMember="Price"/>
            </dxc:XYDiagram2D>
        </dxc:ChartControl>
    </Grid>
</Window>
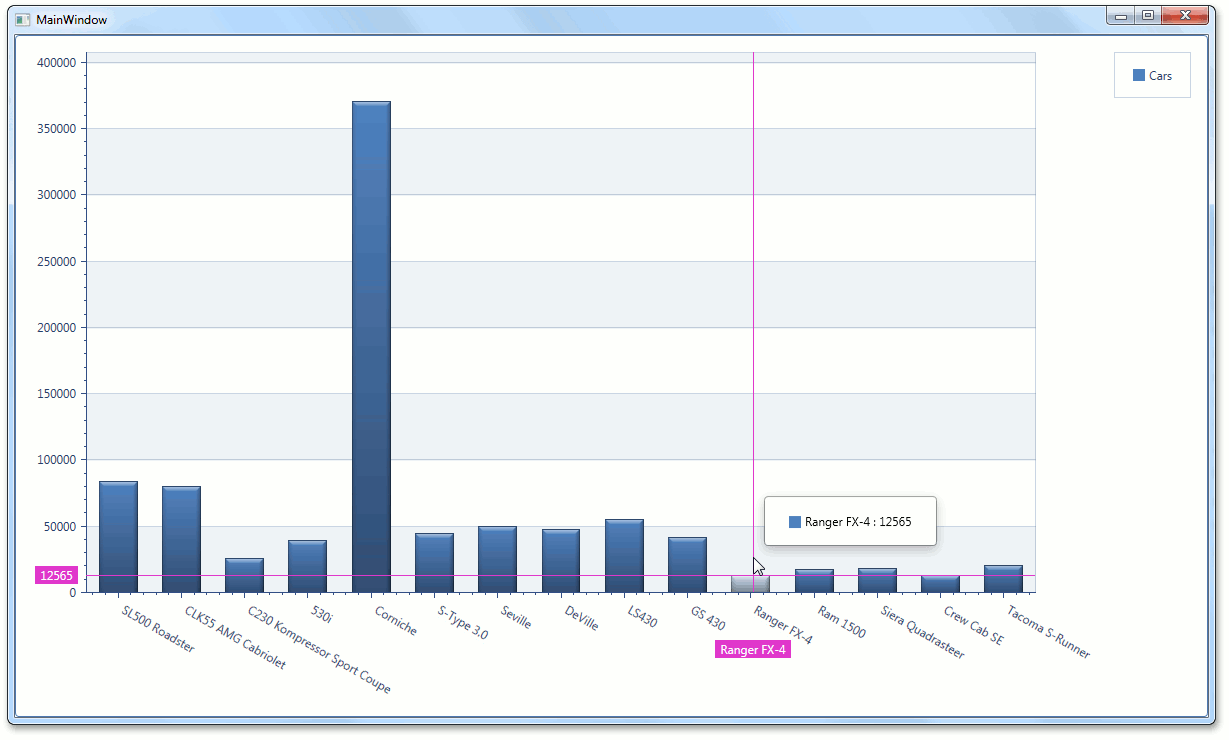
Run the project. The following image illustrates the resulting chart at runtime.
Tip
A complete sample project is available in the DevExpress Code Examples database at http://www.devexpress.com/example=E3155.