TdxCustomChartControl.AddDiagram<T>(string) Method
Declaration
function AddDiagram<T: TdxChartCustomDiagram>(const ACaption: string = ''): T; overload;Parameters
| Name | Type | Description |
|---|---|---|
| ACaption | string | Specifies the created diagram’s title. |
Returns
| Type | Description |
|---|---|
| T | The created diagram. |
Remarks
The AddDiagram function template allows you to create diagrams of any supported type. To create a diagram, you need to instantiate the template with the required diagram class from the following list:
- TdxChartXYDiagram
A diagram designed to display series using the axis of arguments (X-axis and the axis of values (Y-axis). An XY diagram can plot Area, Bar, and Line series.
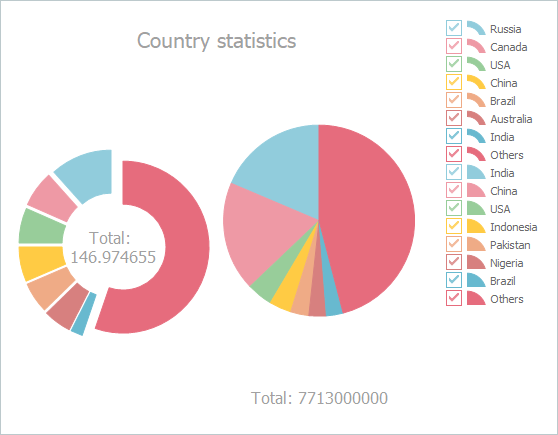
- TdxChartSimpleDiagram
A diagram intended to plot Pie and Doughnut series.
You can use the Diagrams or VisibleDiagrams property to access all created diagrams by their indexes.
Example
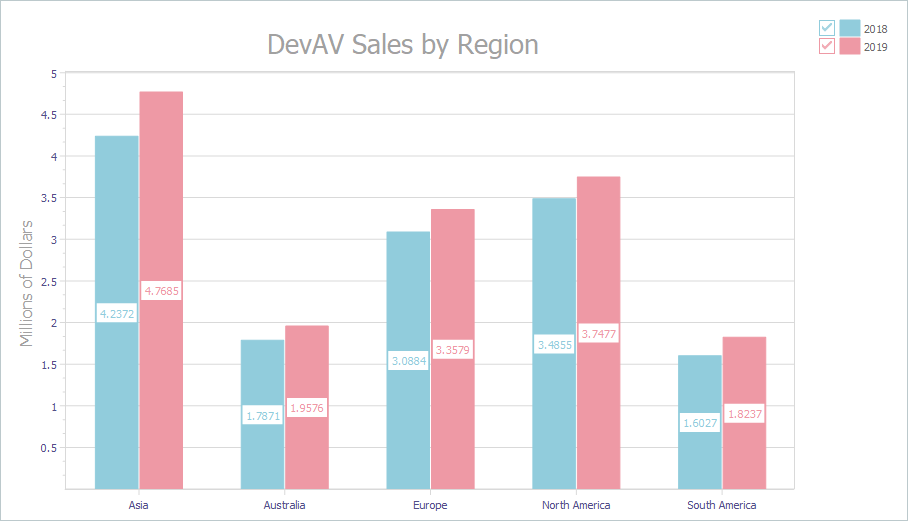
The following code example creates an XY diagram with two Bar chart series and populates them with data in unbound mode:
var
  AXYDiagram: TdxChartXYDiagram;
  AXYSeries: TdxChartXYSeries;
begin
  dxChartControl1.BeginUpdate;  // Initiates the following batch change
  try
    AXYDiagram := dxChartControl1.AddDiagram<TdxChartXYDiagram>('DevAV Sales by Region');
    AXYDiagram.Title.Appearance.FontOptions.Size := 20;
    AXYDiagram.Axes.AxisY.Title.Text := 'Millions of Dollars';
    AXYSeries := AXYDiagram.AddSeries('2018');  // Creates a new XY series with the caption "2018"
    AXYSeries.DataBindingType := 'Unbound';  // Selects the unbound data access mode
    TdxChartXYSeriesUnboundDataBinding(AXYSeries.DataBinding).ArgumentField.ValueType := 'string';
    AXYSeries.ViewType := 'Bar';  // Selects the Bar series View
    AXYSeries.Points.Add('Asia', 4.2372);
    AXYSeries.Points.Add('Australia', 1.7871);
    AXYSeries.Points.Add('Europe', 3.0884);
    AXYSeries.Points.Add('North America', 3.4855);
    AXYSeries.Points.Add('South America', 1.6027);
    AXYSeries.View.ValueLabels.Visible := True;  // Displays value labels on bars
    AXYSeries := AXYDiagram.AddSeries('2019');  // Creates a new XY series with the caption "2019"
    AXYSeries.DataBindingType := 'Unbound';  // Selects the unbound data access mode
    TdxChartXYSeriesUnboundDataBinding(AXYSeries.DataBinding).ArgumentField.ValueType := 'string';
    AXYSeries.ViewType := 'Bar';  // Selects the Bar series View
    AXYSeries.Points.Add('Asia', 4.7685);
    AXYSeries.Points.Add('Australia', 1.9576);
    AXYSeries.Points.Add('Europe', 3.3579);
    AXYSeries.Points.Add('North America', 3.7477);
    AXYSeries.Points.Add('South America', 1.8237);
    AXYSeries.View.ValueLabels.Visible := True;  // Displays value labels on bars
  finally
    dxChartControl1.EndUpdate;  // Calls EndUpdate regardless of the batch operation's success
  end;
end;
Note
To delete a diagram, release it directly in code (call the Free procedure in Delphi or use the delete keyword in C++Builder).