Financial Charting
- 3 minutes to read
This help topic describes the main features available in the DevExpress ASP.NET Chart Control to create professional financial charts.
This topic consists of the following sections.
Financial Series
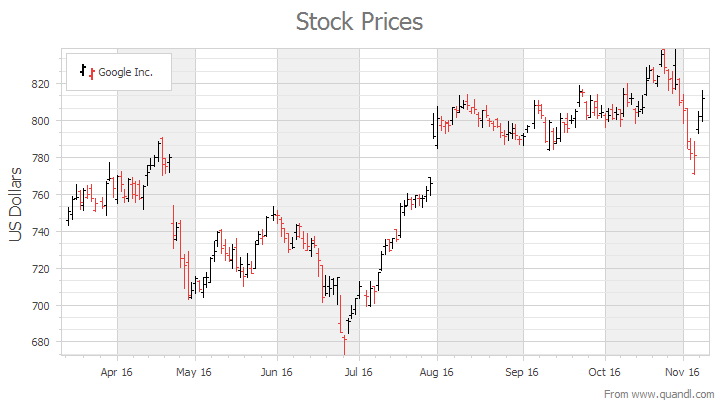
The ASP.NET Chart Control provides two special series view types for financial charting - Stock and Candle Stick (also known as Low-High-Open-Close).
Because these chart types support an XY-Diagram, you can use any compatible series in your financial chart, and use the XYDiagram.Rotated property to rotate these charts (i.e., switch the X and Y axes).
Both the Stock and Candle Stick series provide the FinancialSeriesViewBase.ReductionOptions property. Reduction options allow access to settings for the following purposes:
- To define a particular price value (Open, Close, High or Low) on which a price action analysis is performed (via the ReductionStockOptions.Level property);
- To specify a color to indicate a price reduction (via the ReductionStockOptions.Color property);
- To control whether or not price reductions are indicated within a series (via the ReductionStockOptions.Visible property).
For a Stock chart, you can choose whether or not to only show the opening, closing, or both price levels via the StockSeriesView.ShowOpenClose property.
Use the TextPattern property to define a formatting pattern for series labels. The ResolveOverlappingMode property specifies the mode to resolve overlapping series labels.
For more information about other customization techniques not specific to financial charts, see the following help topic: Advanced Charting.
Days-Off Exclusion and Custom Weeks
To avoid gaps that occur in date-time data when a non-working day is displayed, enable the DateTimeScaleOptions.WorkdaysOnly property of the X-axis and access options provided by the DateTimeScaleOptions.WorkdaysOptions property.
Note
To import a list of holidays (to exclude them from the X-axis scale) in our native Scheduler (.xml) or Microsoft Office Outlook® (.hol) formats from a file, use the WorkdaysOptions.LoadHolidays method.
These options allow you to specify work days to be included in the axis range - and exclude holidays and weekends - to define a custom week.
For a step-by-step tutorial, see the following help topic: How to: Exclude Weekends and Holidays from the Axis Scale.
To learn more about advanced support for the date-time scale type, refer to the following help topic: Data Aggregation.
Technical Indicators
In addition to Strips and Constant Lines, you can use technical indicators (such as Regression and Trend Lines, or Fibonacci and Moving Average indicators) for any 2D XY- Series.
Note that you are not restricted to the available set of indicators. To implement new indicators, you can add series (e.g., Line) and/or display indicators on separate panes tied to a number of secondary axes.
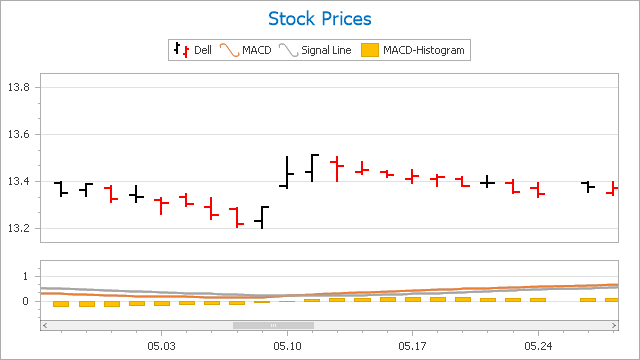
You can use the WebChartControl.IndicatorsPaletteName property to specify a separate palette to paint all indicators on a chart.