Pivot Chart Module Overview
- 13 minutes to read
The PivotChart module provides the capability to analyze data using the XtraPivotGrid, ASPxPivotGrid and XtraCharts controls developed by DevExpress. The XtraPivotGrid and ASPxPivotGrid controls (for Windows Forms and ASP.NET Web Forms platforms respectively) provide end-users with an extremely intuitive experience in slicing and presenting data, and deliver numerous layout customization options with total end-user control over each individual on-screen report. Regardless of the perspective, data can be rendered to answer business questions. The XtraCharts library is designed for both Windows Forms and ASP.NET Web Forms to offer you a comprehensive set of 2D and 3D charts to address a broad range of business needs with ease. The PivotChart module adopts these controls for XAF applications, so you can add the data analysis functionality with ease. This topic details all the basics for using the PivotChart module.
Note
Until the Pivot Chart Module supports Blazor UI, it is possible to integrate the Blazor PivotGrid and Blazor Chart controls into your Blazor application manually. The following topics describe how to do this: Blazor - How to integrate the Pivot Grid into an XAF app | Blazor - How to support the XAF Chart Module scenarios (display charts or graphs).
The PivotChart module is presented in two module projects.
-
Adds references to the DevExpress.ExpressApp.PivotChart.v25.1.dll and DevExpress.ExpressApp.PivotChart.Win.v25.1.dll assemblies.
You can add this module to your Windows Forms module. To do this, invoke the Module Designer and drag PivotChartWindowsFormsModule from the Toolbox to the RequiredModules panel. Alternatively, you can add this module to the Windows Forms application project. To do this, invoke the Application Designer and drag the PivotChartWindowsFormsModule from the Toolbox to the Modules panel. Do not forget to rebuild your solution after making changes in a Designer.
-
Adds references to the DevExpress.ExpressApp.PivotChart.v25.1.dll and DevExpress.ExpressApp.PivotChart.Web.v25.1.dll assemblies.
You can add this module to the ASP.NET Web Forms application project. To do this, invoke the Application Designer and drag the PivotChartASPNETModule from the Toolbox to the Modules panel. Alternatively, you can add this module to your ASP.NET Web Forms module. To do this, invoke the Module Designer and drag the PivotChartASPNETModule from the Toolbox to the RequiredModules panel. Note that in this instance, you will need to manually add pivot templates to the application project. The easiest way to do this is to add the PivotChartASPNETModule module to the application project via the Application Designer and then remove it. This will automatically add all the required templates.
Do not forget to rebuild your solution after making changes in a Designer.
Note
You can add modules to your application when you use the Template Kit to create a new XAF solution. Select modules in the Additional Modules section.
- To add an extra module in code, add it to the XafApplication.Modules or ModuleBase.RequiredModuleTypes list (adding a reference to the module assembly is insufficient).
In .NET applications, you can call the AddPivotChart(IModuleBuilder<IWinApplicationBuilder>, Action<PivotChartOptions>) method in your WinForms application builder.
To see the list of the Pivot Chart module’s Controllers and Actions refer to the Built-in Controllers and Actions in Extra Modules topic.
PivotChart Module Basics
To display data analysis, the PivotChart module contains the AnalysisEditorWin and AnalysisEditorWeb Property Editors for Windows Forms and ASP.NET Web Forms applications respectively. These Property Editors work with properties that reference objects implementing the IAnalysisInfo interface. This interface has the following members.
DataType
Specifies the type of the objects to be analyzed.
Criteria
Specifies the criteria according to which objects will be retrieved from a database to the collection to be analyzed. Function Criteria Operators are supported.
DimensionProperties
A list of the analyzed object type’s properties that will be available for analysis in the pivot grid.
ChartSettingsContent
A byte array representing chart settings.
PivotGridSettingsContent
A byte array representing the configuration of a pivot grid.
InfoChanged
An event raised when some of the IAnalysisInfo object’s properties are changed.
Self
Provides access to the current instance of the class that implements the IAnalysisInfo interface. This property’s value is displayed by the AnalysisEditorWin and AnalysisEditorWeb Property Editors.
XAF supplies the Analysis class that implements the IAnalysisInfo interface. So, you can add the Analysis class to your application’s business model to activate the Analysis functionality supplied with the added PivotChart module. However, if you require, you can implement the IAnalysisInfo interface in a custom class or inherit from the Analysis class. The AnalysisEditorWin and AnalysisEditorWeb Property Editors will be used in any case. When implementing a custom class, have a look at the Analysis class located in the %PROGRAMFILES%\DevExpress 25.1\Components\Sources\DevExpress.Persistent\DevExpress.Persistent.BaseImpl.Xpo (or %PROGRAMFILES%\DevExpress 25.1\Components\Sources\DevExpress.Persistent\DevExpress.Persistent.BaseImpl.EFCore) folder.
The Analysis class populates the DimensionProperties list when its DataType property is changed. For this purpose, it calls the GetDimensionProperties method of the ModelDimensionPropertyExtractor object. This object gets information from the Application Model‘s BOModel | <Class> nodes that define the class that is assigned to the DataType property and its ancestors. Properties whose BOModel | <Class> | OwnMembers | <Member> node has the IModelMemberPivotChartVisibility.IsVisibleInAnalysis property set to true (a default value) are added to the DimensionProperties list. You can change this behavior by inheriting from the static DimensionPropertyExtractor class. The custom Dimension Property Extractor’s instance must be set to the DimensionPropertyExtractor‘s Instance property. To do this, subscribe to the XafApplication.SetupComplete event in your module’s Setup method. If the custom Dimension Property Extractor has an overridden IDimensionPropertyExtractor.GetDimensionProperties method, you should implement a custom Analysis class, and call this method, for example, in the ObjectTypeName property setter.
When the PivotChart module is set up in an application, it adds items to the navigation control for the classes that implement the IAnalysisInfo interface. Be careful not to have more than one class that implements the IAnalysisInfo interface in your business model. Otherwise, you will have several Analysis items in the navigation control. In addition to this Application Model customization, the PivotChart module sets the appropriate Property Editors for the IAnalysisInfo.Self and IAnalysis.DataType properties. Other customizations with the List and Detail Views that represent IAnalysisInfo objects are performed by the Business Class Library Customization module, you can add it if required.
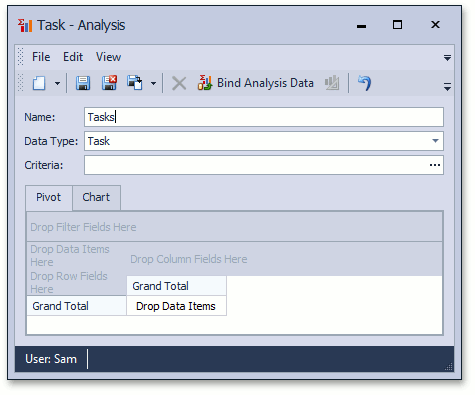
The following image demonstrates the Analysis Detail View.
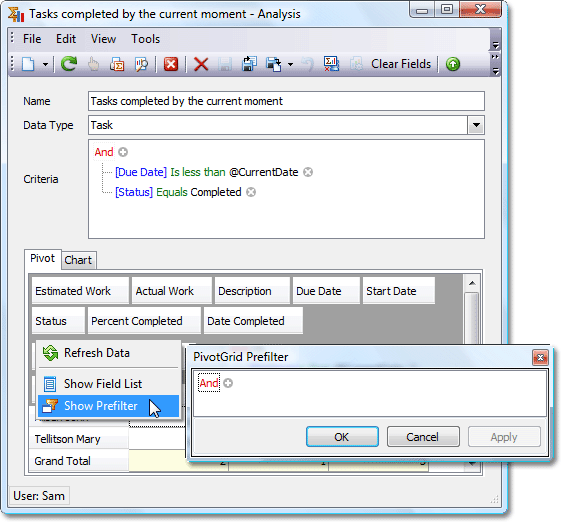
Objects of the specified type are not retrieved from the database to the pivot grid until the BindAnalysisData Action ( ) is pressed. This Action loads only objects that satisfy the criteria specified by the Criteria property and the filter that was previously set in the pivot grid’s Prefilter for the current Analysis object.
Note
Field captions are set to the IModelCommonMemberViewItem.Caption property values of the BOModel | <Class> | OwnMembers | <Member> nodes that correspond to analyzed type properties.
After you have changed something in the current Analysis object, use the UnbindAnalysisData Action ( ) to clear the pivot grid’s data source. Then, use BindAnalysisData Action () again to load objects using the newly set property values of the Analysis object.
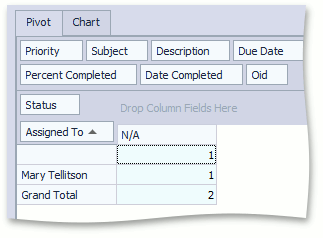
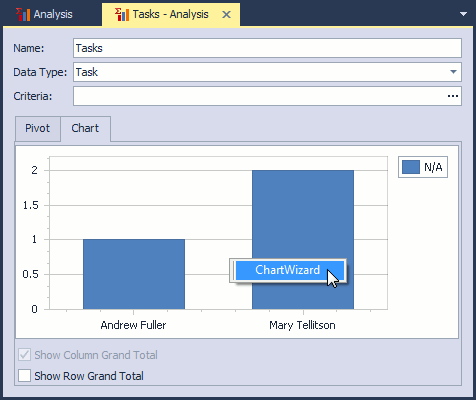
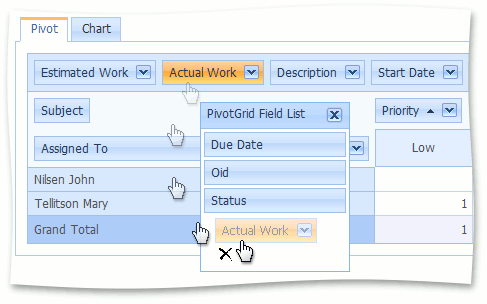
The following image demonstrates an Analysis Detail View with loaded objects. The pivot grid is configured so that you can see how many tasks are assigned to a contact.
In a Windows Forms application:
In an ASP.NET Web Forms application:
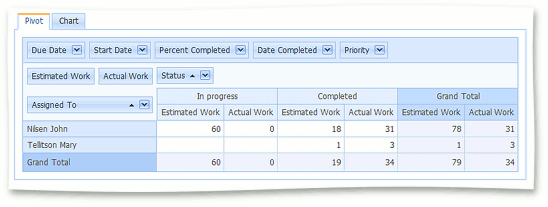
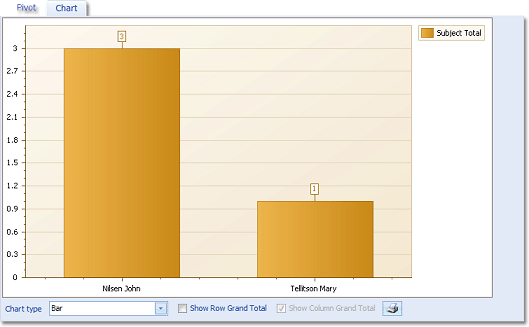
If you switch to the Chart tab, you will see data that is configured in a pivot grid represented by a Chart.
In a Windows Forms application:
In an ASP.NET Web Forms application:
The AnalysisEditorWin Property Editor uses the AnalysisControlWin control to display data. This control contains a tab control with two pages. One page contains a PivotGrid. The second page contains the ChartControl and two check edits: ShowRowGrandTotalCheckEdit and ShowColumnGrandTotalCheckEdit.
The AnalysisEditorWeb Property Editor uses the AnalysisControlWeb control to display data. This control contains a tab control with two pages. One page contains a PivotGrid. The second page contains the ChartControl, ShowRowGrandTotalCheckEdit and ShowColumnGrandTotalCheckEdit check edits, ChartType combo box and PrintChart button.
The pivot grid’s settings are saved to the PivotGridSettingsContent property of the current Analysis object. The settings of the Chart control are saved to the ChartSettingsContent property. So, the next time you invoke a detail View for this Analysis object, the pivot grid and chart are configured in the same way as they were the previous time. Saving and loading settings is performed by the AnalysisEditorWin (AnalysisEditorWeb) editor.
To learn about the capabilities provided by PivotGrid controls in Windows Forms and ASP.NET Web Forms applications, refer to the Visual Elements (XtraPivotGrid) and Visual Elements (XtraPivotGrid) topics. To learn about the capabilities provided by the ChartControl, refer to Visual Elements (XtraPivotGrid) topic.
Set Properties To Be Used as a Pivot Grid Data Source
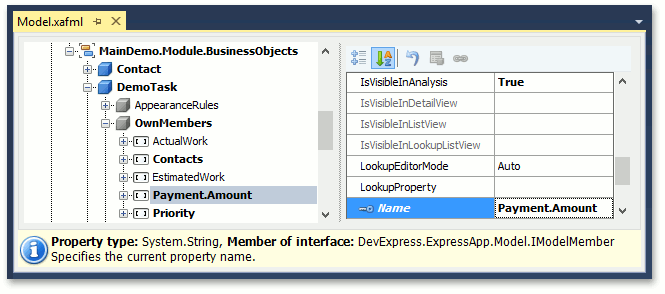
By default, the properties of the class that is assigned to the current Analysis’ DataType property are considered as a pivot grid data source (including the inherited properties). However, only those properties whose BOModel | <Class> | OwnMembers | <Member> application model node has the IsVisibleInAnalysis property set to true (a default value) are added to the pivot grid. You may need to add complex path properties to a pivot grid. For instance, if the Task class has a Payment reference property, you may be required to use the Payment.Amount property when configuring data in the pivot grid for Task type objects. To add complex properties at design-time, use the Application Model. In the Model Editor, navigate to the required BOModel | <Class> node (in our example, Task node), and add a new Member node to it. For the newly added node, set the Name property to the required complex path property (in our example, Payment.Amount). This property specifies the property to be added to the pivot grid. Check that the IsVisibleInAnalysis property it set to true for the new member.
At runtime, use the Field List to hide properties that are temporarily unnecessary.
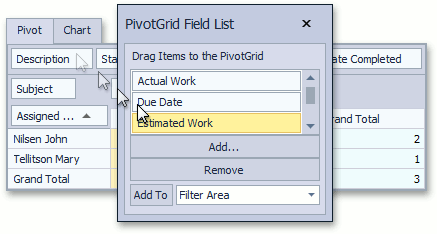
In Windows Forms applications, the Field List has the following buttons.
Add
Use this button to add a property that is not currently available in the pivot grid. In the invoked window, the properties that are displayed in gray are already added to the pivot grid.
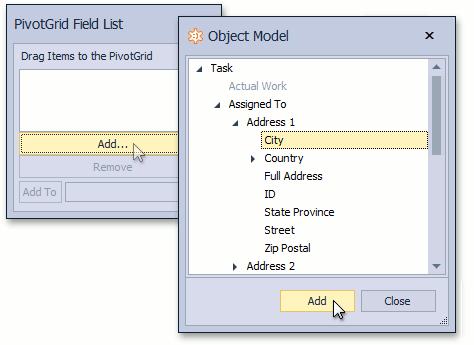
As you can see, you can add complex path properties using this technique.
Remove
Use this button to remove a property that is currently selected in the Field List.
Add To
Use this button to add the property that is currently selected in the Field List to the required area: Row Area, Column Area, Filter Area or Data Area.
When creating an Analysis object in code, you can change the list of properties displayed in the pivot grid using the IAnalysisInfo.DimensionProperties collection. By default, this collection is populated by properties that have the VisibleInAnalysis property set to true in the Application Model. Note that in the built-in Analysis class, this collection is repopulated after the Analysis.ObjectTypeName property has been changed. So, the DimensionProperties collection must be changed after the ObjectTypeName property is set. The following code demonstrates how an object of the Analysis type can be created in the Updater’s ModuleUpdater.UpdateDatabaseAfterUpdateSchema method.
public class Updater : DevExpress.ExpressApp.Updating.ModuleUpdater {
    public override void UpdateDatabaseAfterUpdateSchema() {
        Analysis taskAnalysis1 =
            ObjectSpace.FirstOrDefault<Analysis>(analysis => analysis.Name == "Completed tasks");
        if(taskAnalysis1 == null) {
            taskAnalysis1 = ObjectSpace.CreateObject<Analysis>();
            taskAnalysis1.Name = "Completed tasks";
            taskAnalysis1.ObjectTypeName = typeof(DemoTask).FullName;
            taskAnalysis1.DimensionProperties.Clear();
            taskAnalysis1.DimensionProperties.Add("Subject");
            taskAnalysis1.Save();
        }
        ObjectSpace.CommitChanges();
    }
}
For details on how to create Analysis objects in code, refer to the Distribute an Analysis with the Application topic.
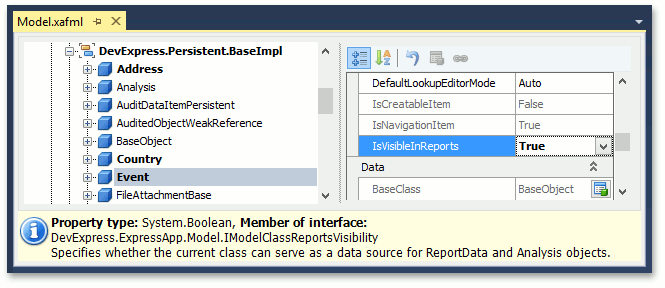
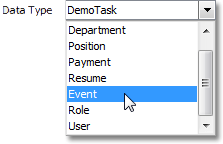
Set Business Object Types to be Available in Analysis
When creating an Analysis object, you should specify the type of the business objects to be analyzed. For this purpose, the DataType property is used. In a UI, this property is displayed by a combo box with an available type list. This list contains only the classes that have the VisibleInReports property set to true in the corresponding BOModel | <Class> node. This property is added to this node by the PivotChart and Reports V2 Module. So, to set this property via the Model Editor, use the project where one of these modules is referenced. Alternatively, you can apply the VisibleInReportsAttribute to a business class in code.
Access the Pivot Grid and Chart Control in Code
You can take advantage of the PivotGrid and ChartControl used by the AnalysisEditorWin or AnalysisEditorWeb Property Editor. To access the required control in code, create a View Controller and handle the Execute event of the AnalysisDataBindController‘s BindData Action. Your Controller should be activated for Detail Views only. So, set the Controller’s ViewController.TargetViewType property to the DetailView value.
In a Windows Forms module:
using DevExpress.ExpressApp;
using DevExpress.ExpressApp.PivotChart.Win;
using DevExpress.ExpressApp.Actions;
using DevExpress.ExpressApp.PivotChart;
using DevExpress.Persistent.Base;
using DevExpress.Persistent.BaseImpl;
using DevExpress.XtraCharts;
using DevExpress.XtraPivotGrid;
//...
public class MyController : ObjectViewController<DetailView, IAnalysisInfo> {
    protected override void OnActivated() {
        base.OnActivated();
        Frame.GetController<AnalysisDataBindController>().BindDataAction.Execute +=
            new SimpleActionExecuteEventHandler(BindDataAction_Execute);
    }
    void BindDataAction_Execute(object sender, SimpleActionExecuteEventArgs e) {
        if((View.CurrentObject as Analysis).DataType == typeof(DemoTask)) {
            foreach(AnalysisEditorWin editor in ((DetailView)View).GetItems<AnalysisEditorWin>()) {
                ChartControl chartControl = editor.Control.ChartControl;
                PivotGridControl pivotGridControl = editor.Control.PivotGrid;
                // Do what you want with the chart and pivot grid controls
            }
        }
    }
}
Important
The following references are required to compile the code above: DevExpress.Charts.v25.1.Core, DevExpress.ExpressApp.PivotChart.v25.1, DevExpress.ExpressApp.PivotChart.Win.v25.1, DevExpress.XtraCharts.v25.1, DevExpress.XtraCharts.v25.1.UI and DevExpress.XtraPivotGrid.v25.1.
In an ASP.NET Web Forms module:
using DevExpress.XtraCharts.Web;
using DevExpress.Web.ASPxPivotGrid;
using DevExpress.ExpressApp;
using DevExpress.ExpressApp.Actions;
using DevExpress.ExpressApp.PivotChart;
using DevExpress.Persistent.Base;
//...
public class MyController : ObjectViewController<DetailView, IAnalysisInfo> {
    protected override void OnActivated() {
        base.OnActivated();
        Frame.GetController<AnalysisDataBindController>().BindDataAction.Execute +=
            new SimpleActionExecuteEventHandler(BindDataAction_Execute);
    }
    void BindDataAction_Execute(object sender, SimpleActionExecuteEventArgs e) {
        if (ViewCurrentObject.DataType == typeof(DemoTask)) {
            foreach (AnalysisEditorWeb editor in View.GetItems<AnalysisEditorWeb>()) {
                WebChartControl chartControl = editor.Control.ChartControl;
                ASPxPivotGrid pivotGridControl = editor.Control.PivotGrid;
                // Do what you want with the chart and pivot grid controls
            }
        }
    }
}
Important
The following references are required to compile the code above: DevExpress.ExpressApp.PivotChart.v25.1, DevExpress.ExpressApp.PivotChart.Web.v25.1, DevExpress.XtraCharts.v25.1, DevExpress.XtraCharts.v25.1.Web, DevExpress.Charts.v25.1.Core, DevExpress.PivotGrid.v25.1.Core, DevExpress.Web.ASPxPivotGrid.v25.1 and System.Web.