How to: Add the Pivot Chart Module (.NET)
- 3 minutes to read
This article describes how to add the Pivot Chart module to your application for data analysis.
Step-by-Step Instructions
Add the DevExpress.ExpressApp.PivotChart NuGet package to the MySolutionName.Module project. See the following topic for more information on how to install DevExpress NuGet packages: Choose Between Offline and Online DevExpress NuGet Feeds.
In the Solution Explorer, go to the MySolutionName.Module project and open the Module.cs file. Add the Pivot Chart module to the RequiredModuleTypes collection. Then, add the
Analysisclass to the AdditionalExportedTypes collection://... namespace MySolution.Module; //... public sealed class MySolutionModule : ModuleBase { public MySolutionModule() { //... RequiredModuleTypes.Add(typeof(DevExpress.ExpressApp.PivotChart.PivotChartModuleBase)); AdditionalExportedTypes.Add(typeof(DevExpress.Persistent.BaseImpl.EF.Analysis)); } //... }Optional. If you use Entity Framework Core, go to the MySolutionName.Module\BusinessObjects folder, open the MySolutionNameDbContext.cs file, and register the
Analysistype in the application’sDbContext://... namespace MySolution.Module.BusinessObjects; //.. [TypesInfoInitializer(typeof(DbContextTypesInfoInitializer<MySolutionDbContext>))] public class MySolutionDbContext : DbContext { public MySolutionDbContext(DbContextOptions<MySolutionDbContext> options) : base(options) { } public DbSet<Analysis> Analysis { get; set; } //.. } //...Note
Unlike native EF Core, XAF automatically updates database schema when the structure of business objects changes. However, you can use EF Core migrations to update database schema manually. Refer to the following help topic for additional information: Update Database Schema and Migrations in EF Core.
Add the DevExpress.ExpressApp.PivotChart.Win NuGet package to the MySolutionName.Win project.
In the Startup.cs file, call the AddPivotChart(IModuleBuilder<IWinApplicationBuilder>, Action<PivotChartOptions>) method to register the Pivot Chart module in the application builder:
//...
namespace MySolution.Win;

public class ApplicationBuilder : IDesignTimeApplicationFactory {
    public static WinApplication BuildApplication(string connectionString) {
        var builder = WinApplication.CreateBuilder();
        builder.UseApplication<MySolutionWindowsFormsApplication>();
        builder.Modules
            .AddPivotChart()
            //...
    }
//...
}
Build the project and run the application. In the navigation control, select the Reports | Analysis item:
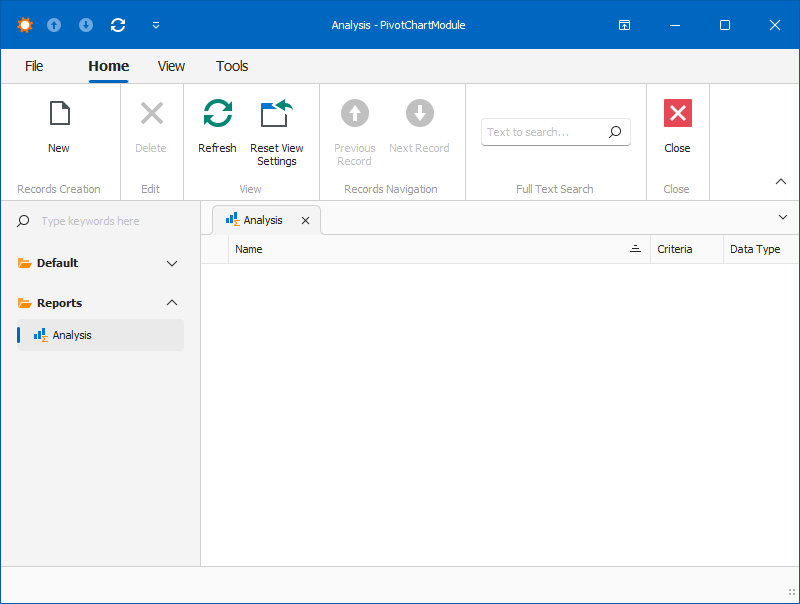
Click the New button to create a new Analysis object. In the object’s Detail View, specify the Name of the new object.
To use objects of a particular type as the data source of your pivot grid, choose this type in the Data Type drop-down menu and click the Bind Analysis Data button.
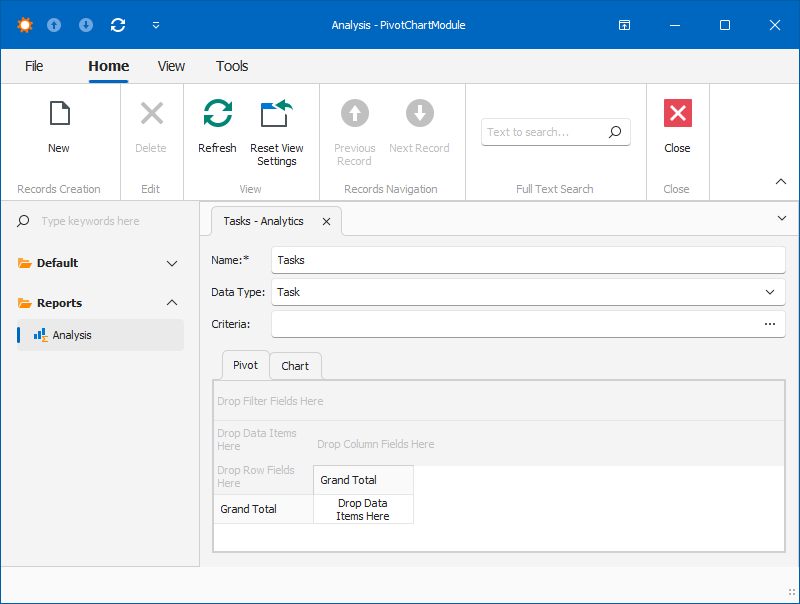
The properties of the bound data type appear as draggable elements in the pivot grid editor:
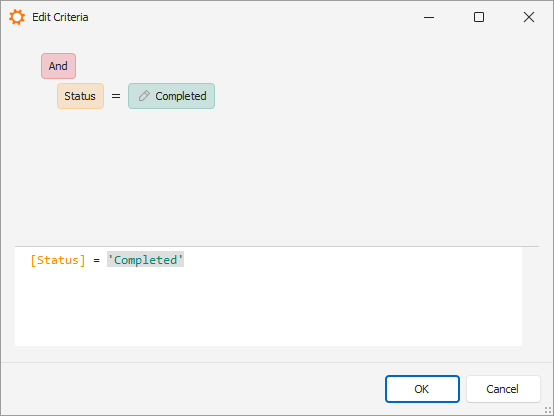
In the Criteria field, click the ellipsis button to invoke the Edit Criteria dialog window. You can visually design a criteria expression in this window. The expression should comply with the Criteria Language Syntax.
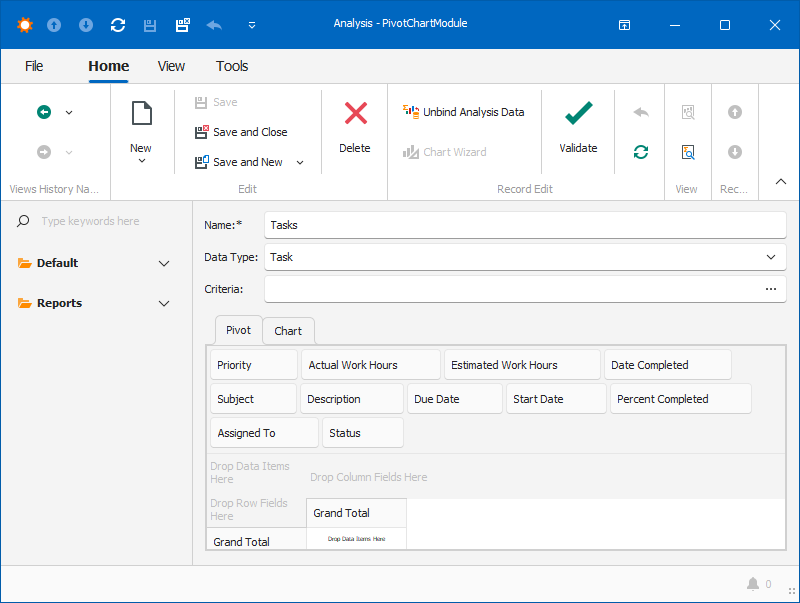
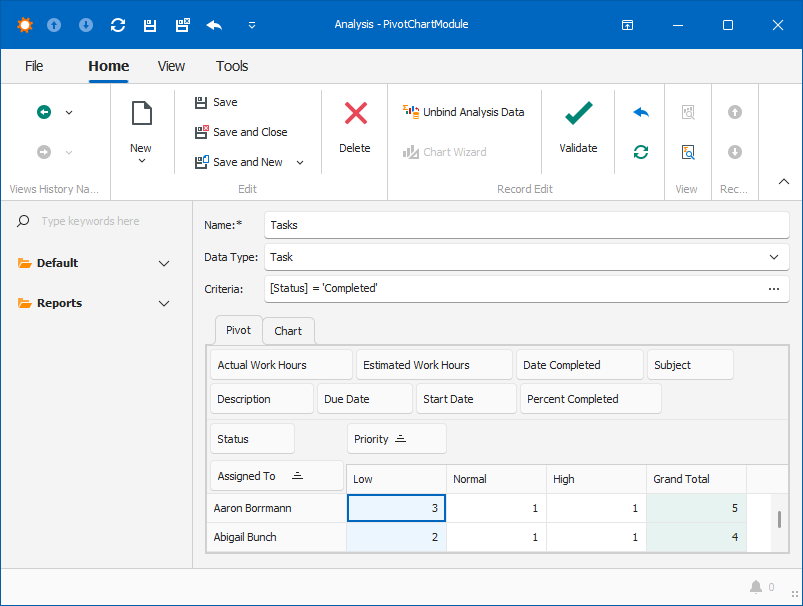
Drag the required properties to the row, column, and data areas of the pivot grid. The following example demonstrates how to display completed tasks by their priority:
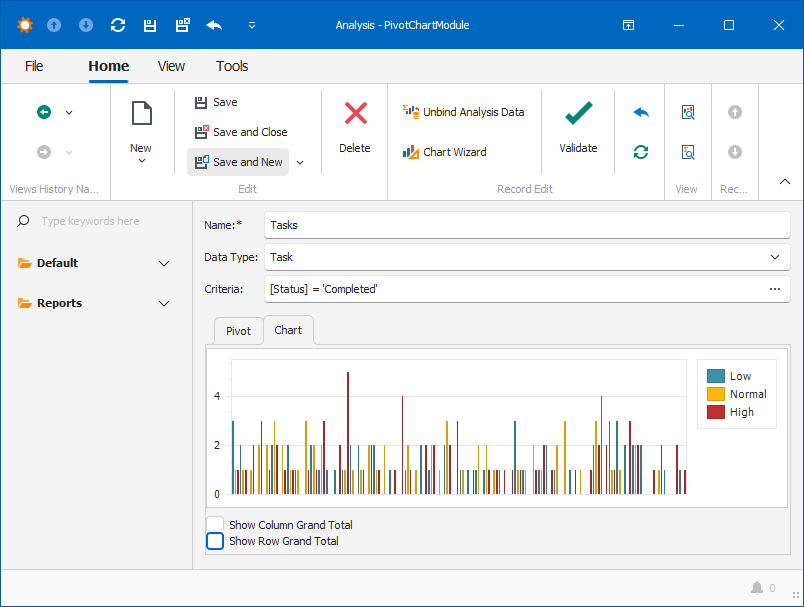
Switch to the Chart tab. It displays a chart based on the data you configured in the pivot grid:
Note
To customize the chart’s settings, right-click the chart and choose the Chart Wizard option.
To export the pivot grid or pivot chart, go to the File > Export Analysis to main menu item and select the export format.