End-User Report Designer in ASP.NET Core Applications
- 2 minutes to read
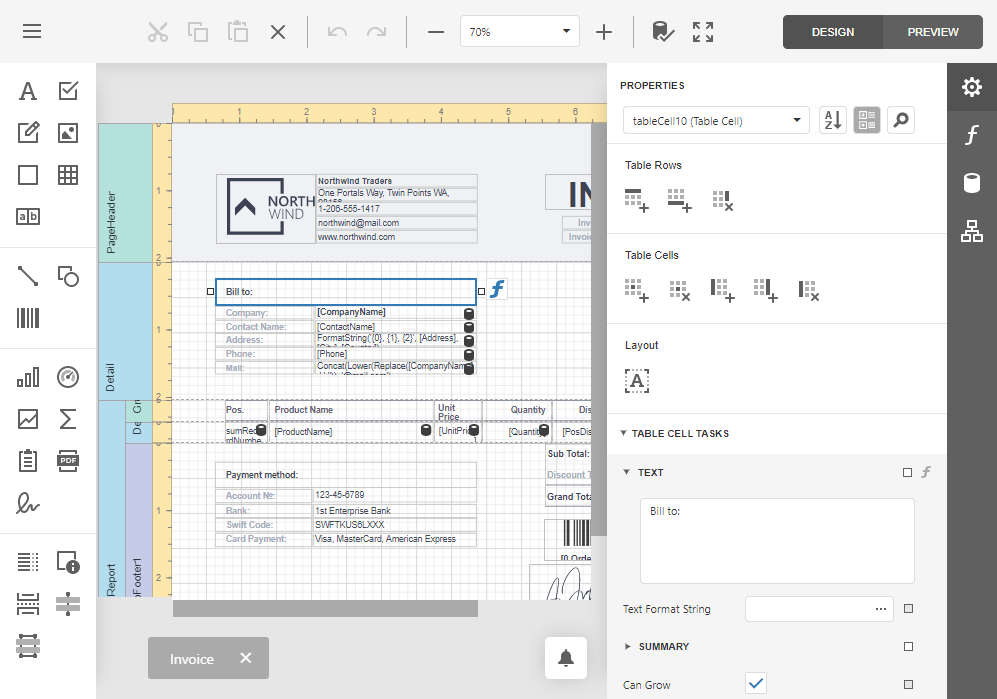
This section describes the ASP.NET Core Report Designer component that allows users to create and edit DevExpress reports.
Prerequisites
- Visual Studio 2019 v16.6 or later to develop applications based on .Net 5.
- Visual Studio 2019 v16.4 or later to develop applications based on .Net Core 3.1.
- Visual Studio 2017 v15.7 or later to develop applications based on .Net Core 2.1.
Visual Studio should have the following workloads:
- ASP.NET and web development
- .NET Core cross-platform development
Note
- Review the following help topic: Limitations of .NET/.NET Core Applications.
In .NET 6, the System.Drawing.Common library is compatible with Windows only. An exception is thrown on other platforms. See the following topic for more information: System.Drawing.Common is Supported on Windows Only.
Add the Report Designer to Your Application
Review these tutorials to configure the Report Designer component in your ASP.NET Core application:
- Add an End-User Report Designer to a DevExtreme ASP.NET Core Application
- Add an End-User Report Designer to an ASP.NET Core Application
- Create an ASP.NET Core Application with a Report Designer
- Create an Angular Application with a Report Designer From Template
- Add Report Storage to ASP.NET Core Application
- Use Data Sources and Connections
- Add Features to the Report Designer (optional)
Refer to the following help topic for information on how to add a report to an ASP.NET Core application:
Customization
A general technique that allows you to customize the UI elements in Reporting components: Use Custom HTML Templates.
For information about specific customization tasks, review the following help topic: End-User Report Designer Customization (ASP.NET Core).
Best Practices
For code samples, review the following help topic: ASP.NET Core Reporting Best Practices.
Features
- Support for various report types (Table Report, Master-Detail Report, Invoice Report, Vertical Report, and so on)
- Open and Save Reports
- 20+ Report Controls (including a Pivot Table and Charts)
- Bind reports to data (SQL, JSON, Excel, XPO, and Object Data Sources)
- The Data Source Wizard and Query Builder
- The Report Wizard
- Integrated Document Viewer
- Bookmarks and Document Map
- Data Grouping, Sorting, and Drill Down
- Zooming
- Calculated Fields and Report Parameters
- Skeleton Screen
- Themes
- Advanced Customization API
Troubleshooting
If you experience a problem with a Web Reporting application, review the following help topics: