Reporting
- 3 minutes to read
DevExpress Reporting is a feature-complete reporting platform for WinForms, WPF, WinUI, ASP.NET Web Forms, ASP.NET MVC, ASP.NET Core, and Blazor Server that enables you to create reporting applications.
Try DevExpress Reports In Your Project
Visit DevExpress.com to learn more about this product’s features, capabilities, and pricing options: Reporting Subscription. To try DevExpress controls and libraries in your projects, download our fully-functional 30-day trial version.
Reporting Components
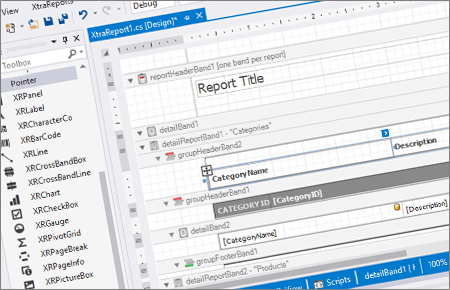
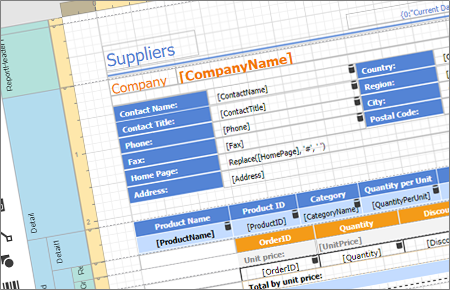
Visual Studio Report Designer and Preview | |
| A feature-rich Report Designer for creating platform-agnostic reports in Visual Studio at design time. You can publish the created reports on any supported platform: WinForms, WPF, WinUI, ASP.NET Web Forms, ASP.NET MVC, ASP.NET Core, and Blazor Server. |
End-User Report Designer and Document Viewer | |
| Fully customizable End-User Report Designer and Document Viewer for the following platforms: You can integrate these components in your application or create a new reporting application. |
Report Features
Supply Data | |
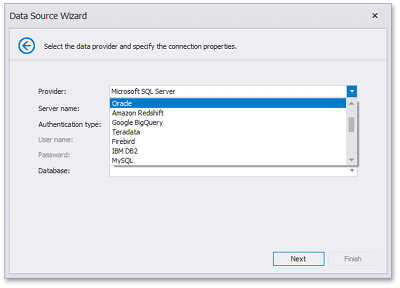
| DevExpress Reporting allows you to use various data source types (SQL databases, Entity Framework data sources, custom objects, or Excel files) to fetch data to your reports. You can bind report elements to individual data source fields or create binding expressions of any complexity. These expressions can include multiple data source fields and functions. |
Report Controls | |
| DevExpress Reporting includes controls like charts, cross tabs, gauges, bar codes, for visualizing data. |
Shape Report Data | |
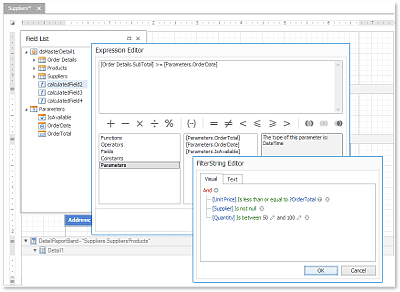
| DevExpress Reporting offers the following data shaping features:
|
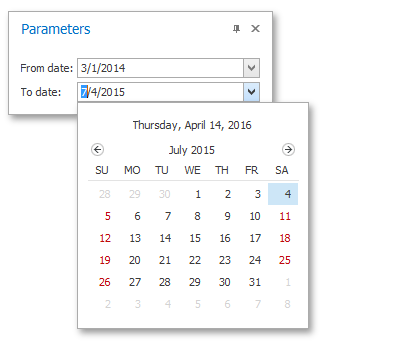
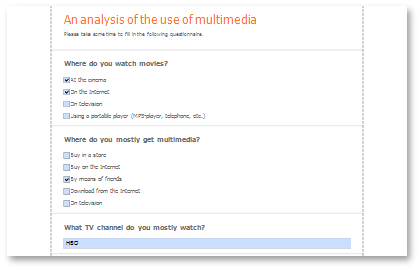
Use Report Parameters | |
| Use report parameters to filter data in a previewed document. Multi-value and cascading parameters are supported. You can embed query parameters into an SQL string to filter data at the data source level. |
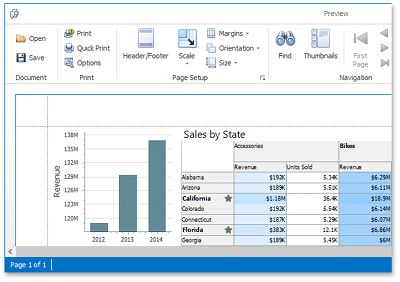
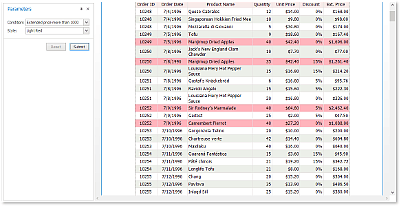
Interactive Print Preview | |
| Allow users to customize report content in Print Preview:
|
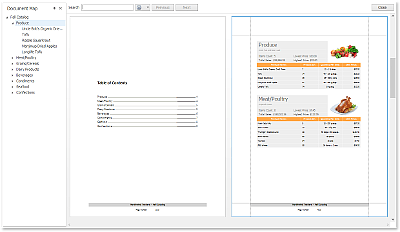
Report Navigation | |
| DevExpress Reporting allows you to create bookmarks and use cross references to display the document structure in a document map and table of contents and switch between different document sections. |
Style and Appearance Settings | |
| You can use style sheets to specify report element appearance settings or conditionally change these settings. |