Tutorial 2 - Design the Report Layout
- 5 minutes to read
In the previous tutorial, we bound a blank report to an SQLite database. This tutorial describes how to display data from this database in a table and format the content of table cells.
A Brief Reminder on Report Bands
Any report consists of bands. A band can appear at the beginning or end of the report, on every printed page, once for each data record, and so on.
In this tutorial, we will use the Detail band to display table data and the Group Header band to display the table header. For more information on report bands, refer to the following topic: Introduction to Banded Reports.
Create and Customize a Table
Follow the steps below to create a table and display data from the database in this table.
Create a Table with Cells Bound to Database Fields
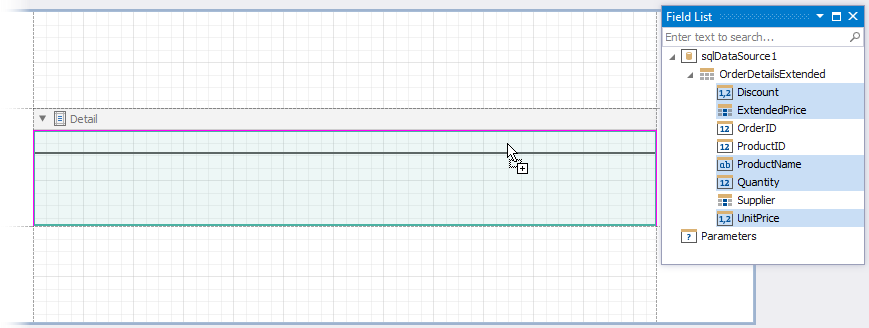
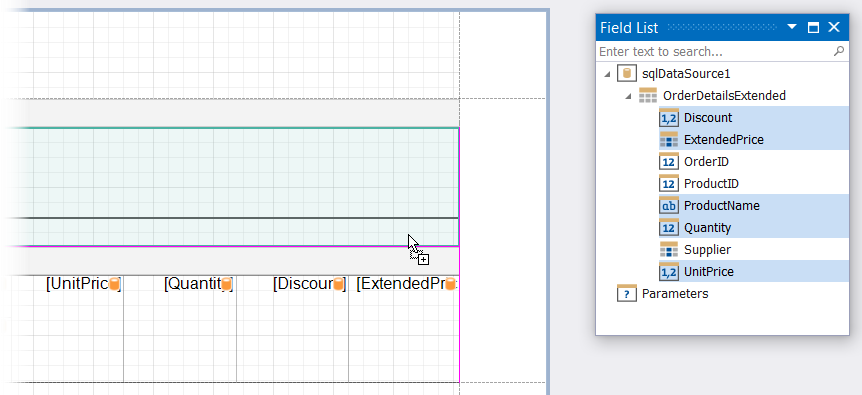
Expand the OrderDetailsExtended view in the Field List and select the following fields:
- ProductName
- UnitPrice
- Quantity
- Discount
- ExtendedPrice
Hold Ctrl or Shift and click the fields in the same order they are listed above. Then, drop the fields onto the Detail band.
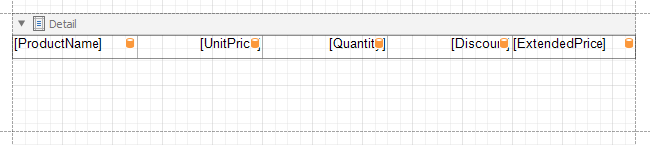
This action creates a table (the XRTable control) where every cell is bound to the corresponding field from the OrderDetailsExtended view.
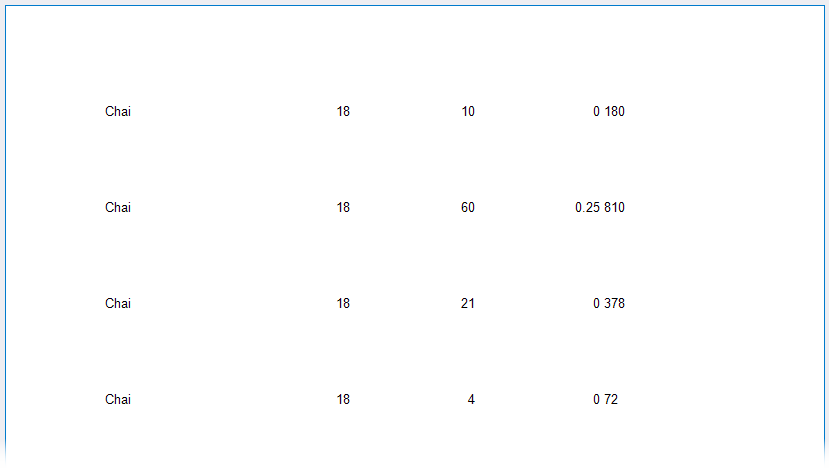
The Detail band is printed for each record of this view. You can switch to the Preview tab to see the intermediate result:
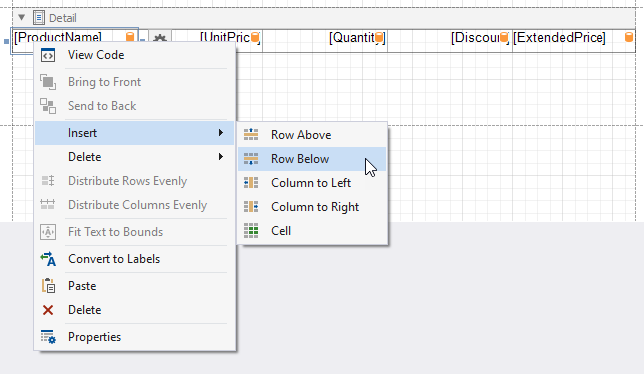
Insert a row to the table. Right-click the table and select Insert | Row Below in the context menu.
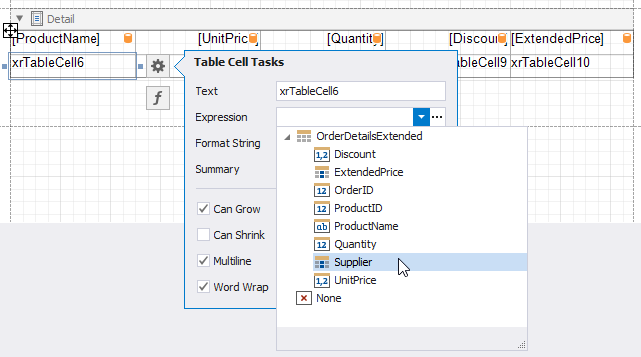
Make the first cell of the inserted row display data from the Supplier field. Select the first cell of the inserted row. Click the cell’s smart tag and assign the Supplier field to the cell’s Expression property.
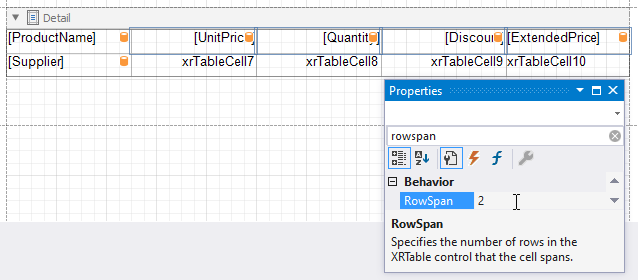
Make the following cells span across two table rows:
- UnitPrice
- Quantity
- Discount
- ExtendedPrice
Select these cells, navigate to the Properties panel, and set the RowSpan property to 2.
Format Table Cells Data
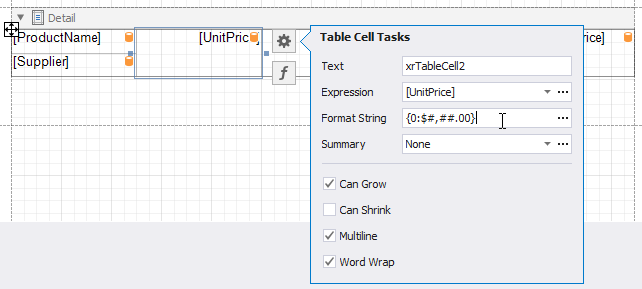
Click the UnitPrice cell’s smart tag and set the Format String property to {0:$#,##.00}.
In the same way, set a format string for the Discount and ExtendedPrice cells to {0:0\%} and {0:$#,##.00}, respectively.
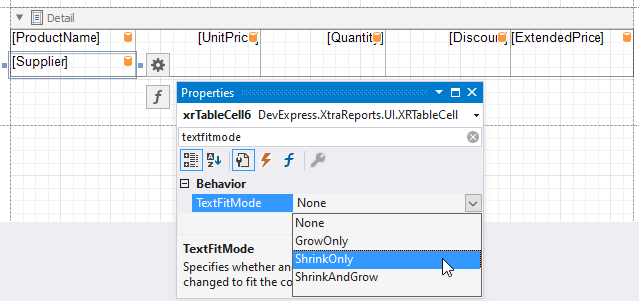
Set the Supplier cell’s TextFitMode property to ShrinkOnly. This action adjusts the cell’s font size so that the cell’s text content occupies the entire cell. Disable the cell’s CanGrow and CanShrink properties before you change the cell’s TextFitMode property.
Set Up Table Size
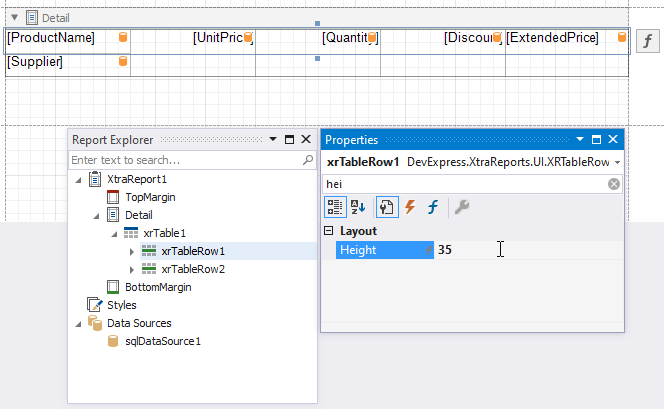
Set up table row heights. Switch to the Report Explorer, select the table’s first row, and set its Height property to 35.
Similarly, set the height of the table’s second row to 55.
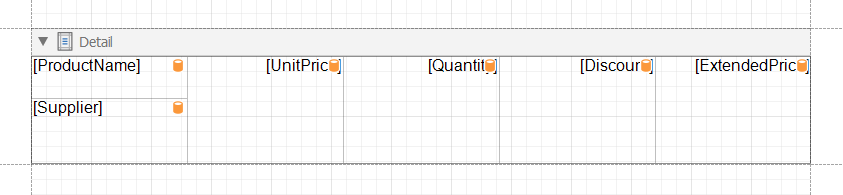
Set the Detail band’s Height property to 90 and the TextAlignment property of the ExtendedPrice cell to TopRight.
As a result, the table occupies the entire Detail band, and this band should look as follows.
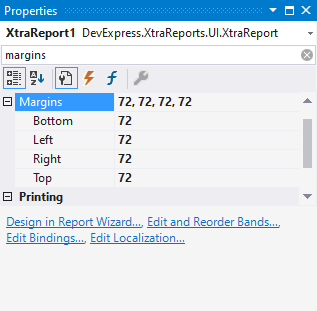
Set up the table’s width. Set the size of all report margins to 72.
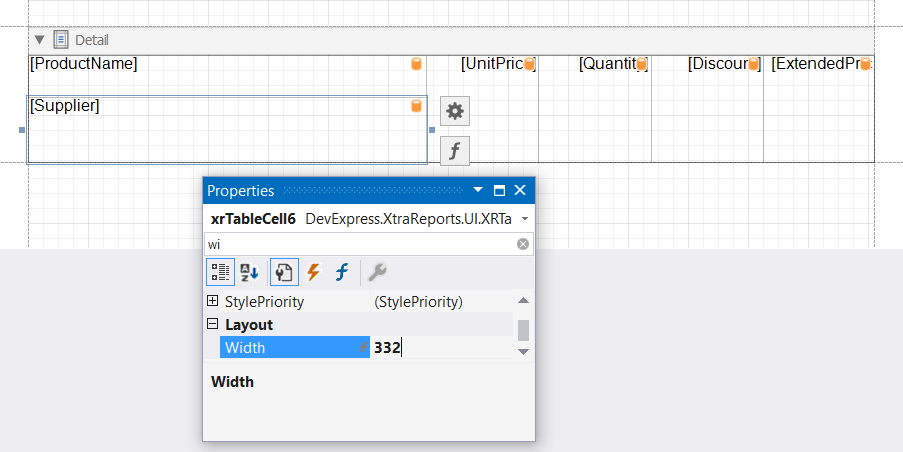
Set the widths of the cells from the first table column to 332, and the widths of the cells from the remaining columns to 93.5.
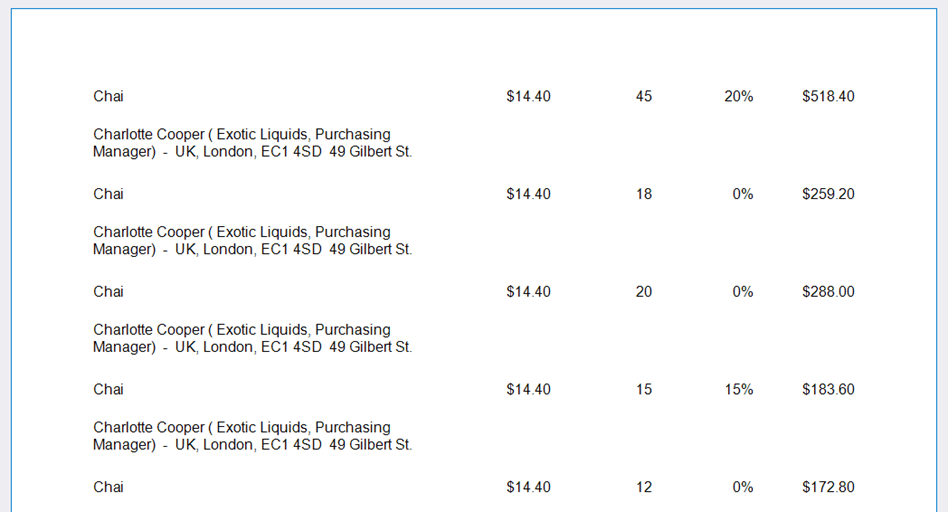
Switch to the Preview tab to see the draft version of your report.
Create and Customize a Table Header
This section explains how to add the Group Header band to the report and configure this band to display a table header on each report page. Follow the steps below to complete this task.
Add the Group Header Band to the Report
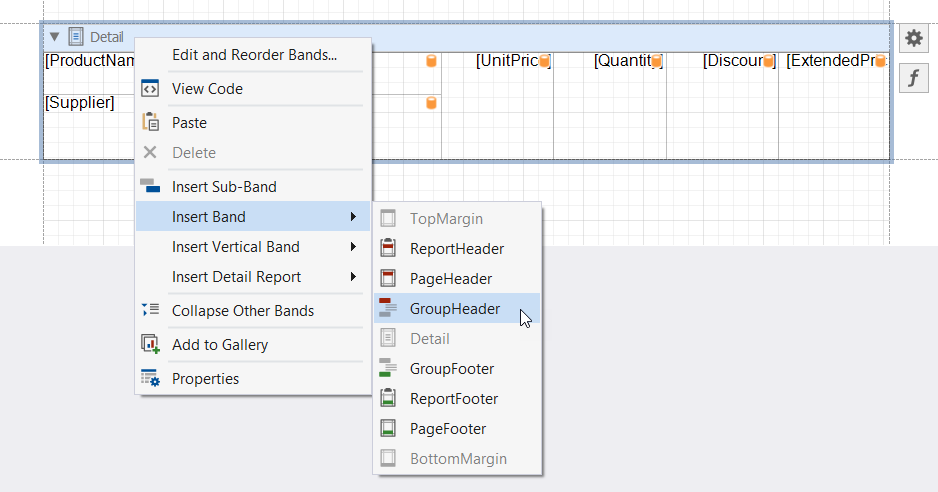
Right-click the report surface and select Insert Band | GroupHeader from the context menu.
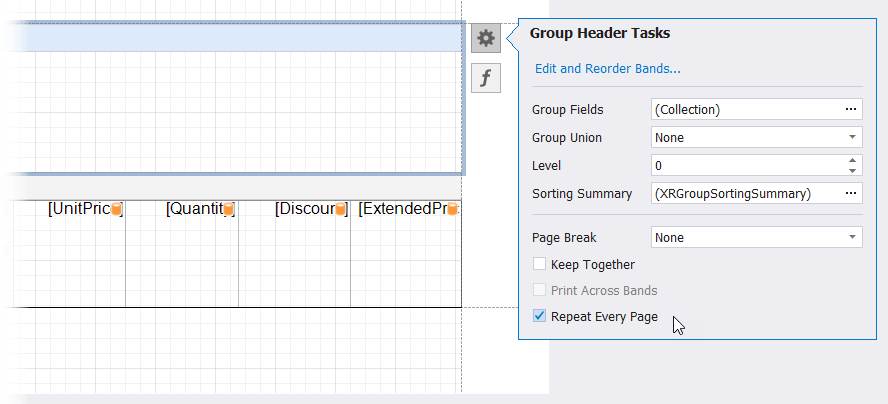
Enable the GroupHeader band’s Repeat Every Page property.
Add Table Column Headers to the Group Header Band
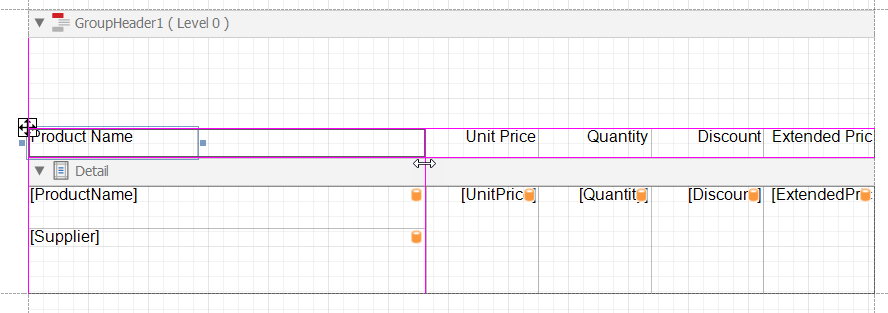
Switch to the Field List. Select the fields for which you want to create column headers (ProductName, UnitPrice, Quantity, Discount, ExtendedPrice). Drag and drop the selected fields onto the GroupHeader band while holding down the right mouse button.
This action creates a table (the XRTable control) with every cell containing the name of the corresponding field from the OrderDetailsExtended view.
Set the ExtendedPrice cell’s TextAlignment property to TopRight. Adjust the width of the created header cells to make them fit the width of the corresponding table cells in the Detail band.
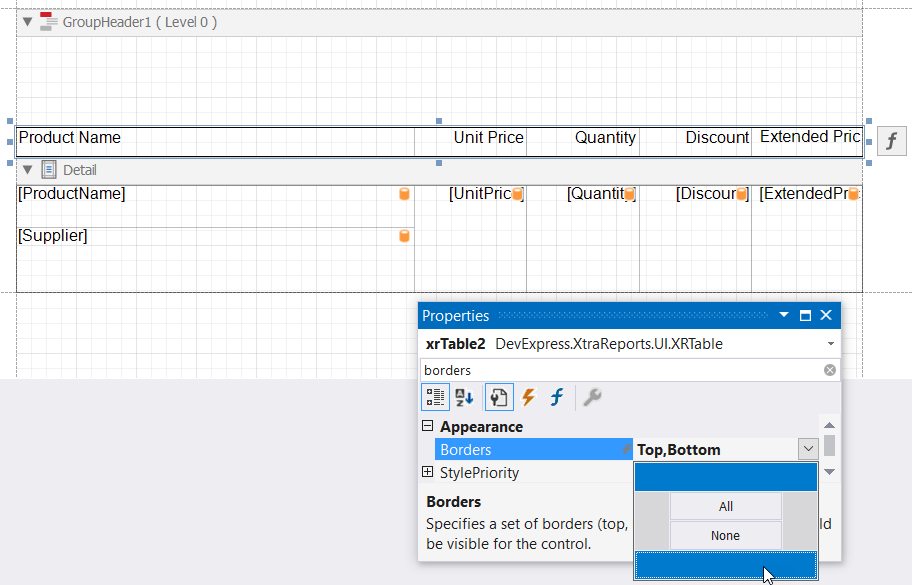
Draw Table Borders
Select the header, navigate to the Properties panel, and enable top and bottom borders for this header. To do this, expand the Borders property’s drop-down list and click on the top and bottom rectangles.
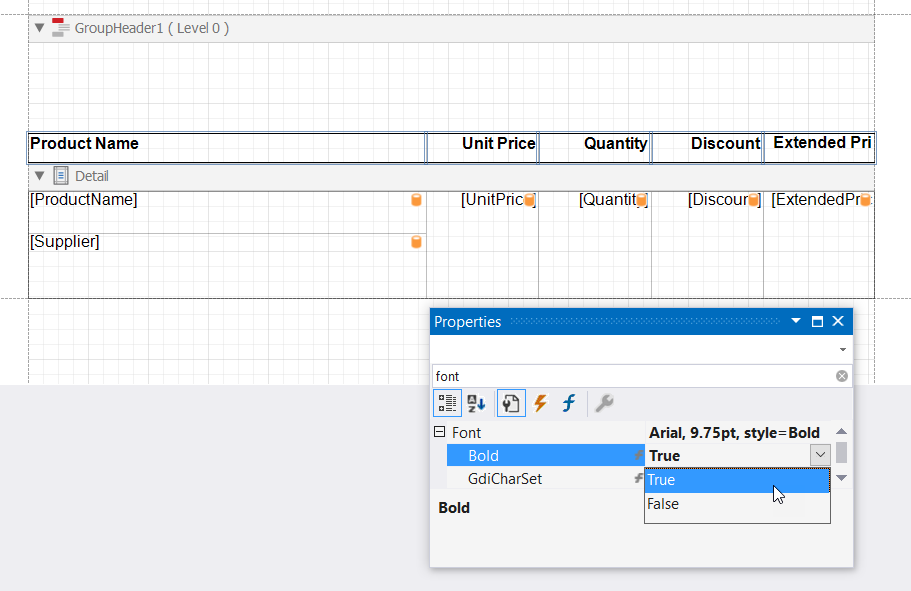
Select all header cells and make their font bold.
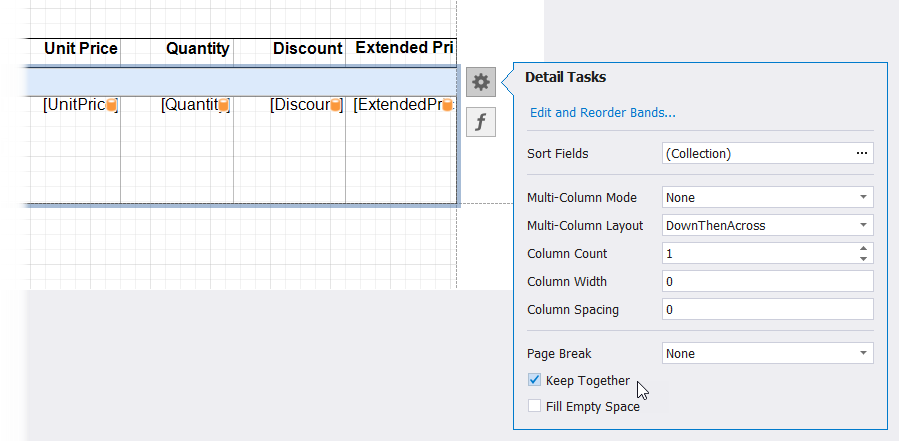
Enable the Detail band’s Keep Together property. If this property is enabled, the last record on a report document page is moved to the next page if this record does not fit into the current page.
Enable the bottom border for the Detail band.
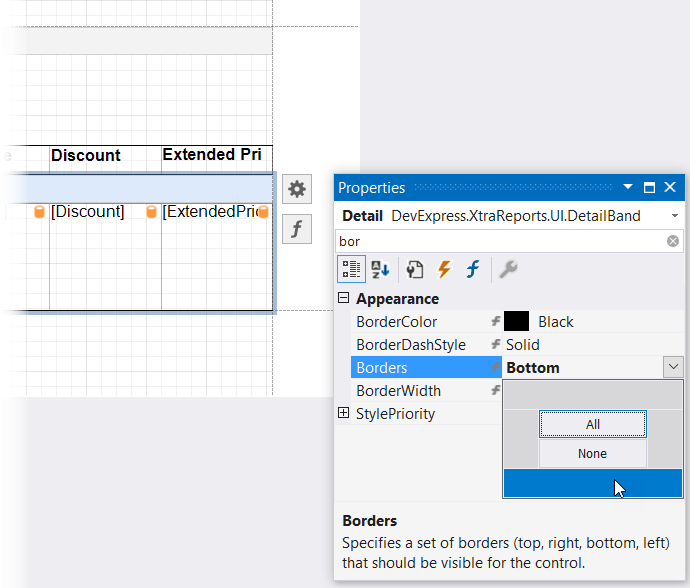
Note that after you complete this operation, the bottom border of the table’s upper left cell also becomes enabled due to style inheritance. Disable the bottom border for this cell.
You might also notice that we enabled only the bottom border for the Detail band, and the upper and bottom borders for the table header. We did this to avoid duplication of the Detail band borders. See the following topic for more information: Draw Borders (Lines) for Report Controls.
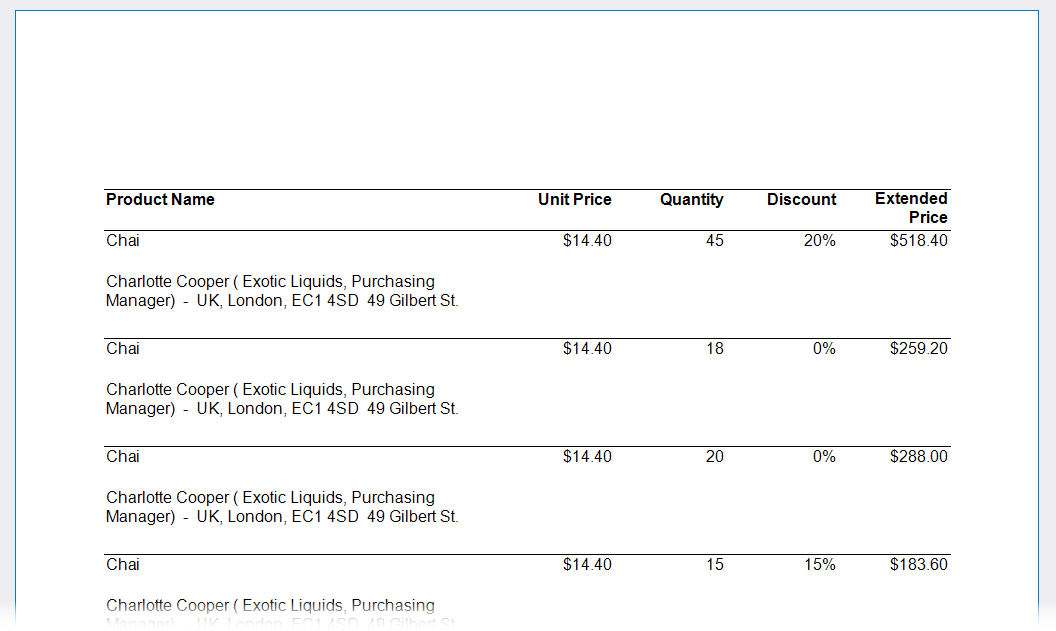
Switch to the Preview tab to see the final version of your report.
Summary
In this tutorial, we created a report that displays data in a table format. We also covered the basics of expressions and data formatting. Refer to the following documentation section for more details: Expressions Overview.
The created report currently displays all data from the datasource when you switch to Preview. In some cases, you might want to supply only part of your data to a report and generate a report document using only this data.
The following tutorial explains how to use report parameters to filter report data based on a certain condition: Tutorial 3 - Use Parameters to Filter Report Data Dynamically.