Choose Columns (Multi-Query Version)
- 2 minutes to read
Note
The default Report Designer implementation uses the Report Wizard (Fullscreen) version. To use the popup version instead, disable the ReportDesignerWizardSettings.UseFullscreenWizard option.
This wizard page allows you to select data members for a report and its detail reports, as well as choose data fields to display in these reports.
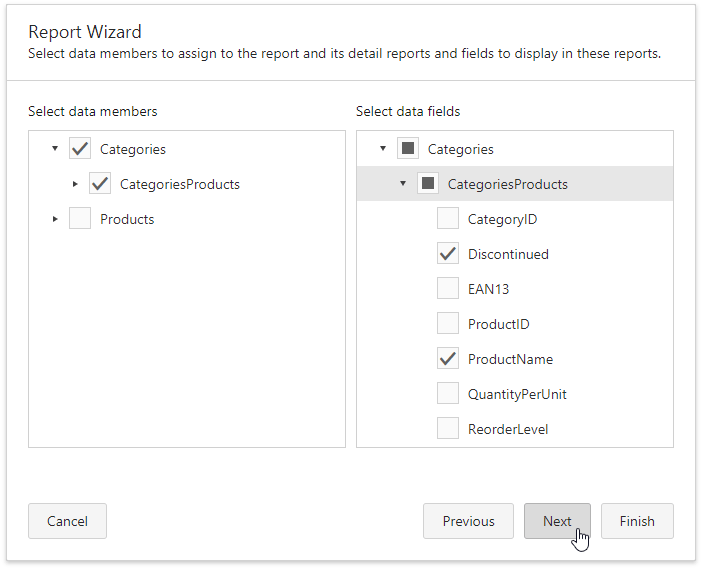
The list on the left-hand side displays available queries and master-detail relationships. Select the required checkboxes to create relevant reports and assign their DataMember property.
In the list on the right-hand side, choose data fields from the selected data members to include them in corresponding reports.
After completing the wizard, the report is constructed according to the following rules:
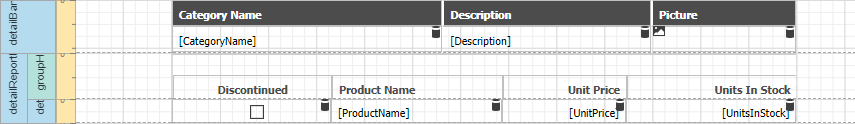
- If you select one query, it is assigned to the report’s XtraReportBase.DataMember property. The selected fields with their corresponding captions are automatically added to the report’s Detail Band.
- If you select two or more queries, this creates the Detail Report Band for each query at the same hierarchical level. These detail reports’ DataMember properties are assigned to the corresponding queries.
- For each selected master-detail relationship, the Detail Report Band with the DataMember property set to this relationship is created under the corresponding master report.
You can stop the wizard at this step by clicking Finish. The created report looks similar to the image below.
If you want to customize the report further, click Next to go to the Create Groups (Multi-Query Version) page.