DevExpress Reports Feature Guide
- 11 minutes to read
The Feature Guide describes DevExpress Reports capabilities for desktop and web applications. It explains report design, data binding, content shaping and formatting, layout management, interactivity, export and printing, localization, and other key features.
Tip
If you are new to DevExpress Reports, refer to the following help topic for information on core concepts and basic workflows: Get Started with DevExpress Reports.
Note
The help topics in this guide focus primarily on design-time configuration in the Visual Studio Report Designer. The same functionality is available at runtime through the End-User Report Designers or Reporting API. Feature availability may vary depending on the target platform.
Banded Reports
What Is a Banded Report?
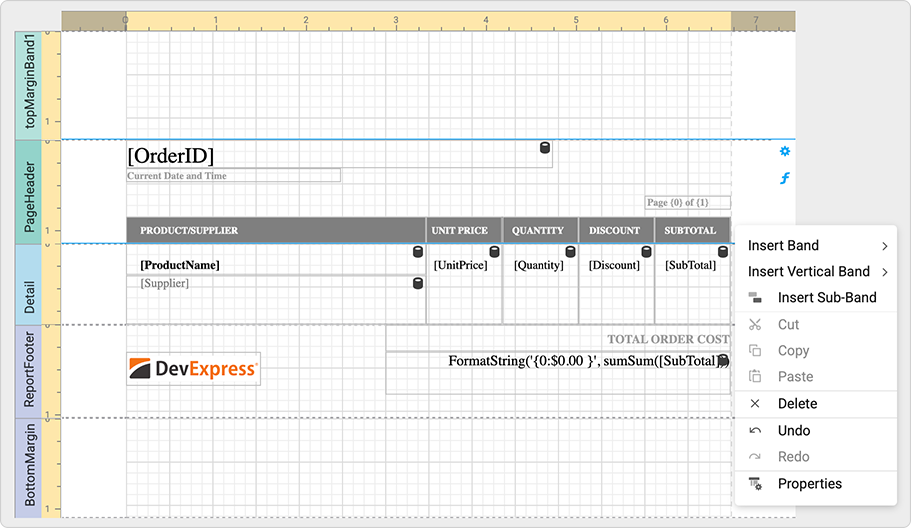
DevExpress Reports uses a banded layout structure. In a banded report, content is organized into bands (such as Report Header, Detail, Group Header, and Report Footer). Each band contains report controls and defines how and when content appears on document pages.
When a report document is generated, bands are printed from top to bottom on each page. The reporting engine processes bands sequentially. Controls inside each band render according to the band’s role (Detail, Group Header, Report Footer, etc.).
Why Use Bands?
Bands are the foundation of all report types (including master-detail and grouped reports).
Bands help you:
- Separate static and data-bound content
- Repeat content per record or group
- Add totals and summaries
- Control page-level layout
How to Convert Third-Party Reports?
You can migrate reports created in third-party reporting tools (for example, Microsoft Access, Crystal Reports, RDLC (for SQL Server Reporting Services), and ActiveReports) to DevExpress Reports. You can also convert single reports in the Visual Studio Report Designer, or use the command-line utility for batch operations.
Refer to the following help topic for additional information: Convert Third-Party Reports to DevExpress Reports.
Data Binding
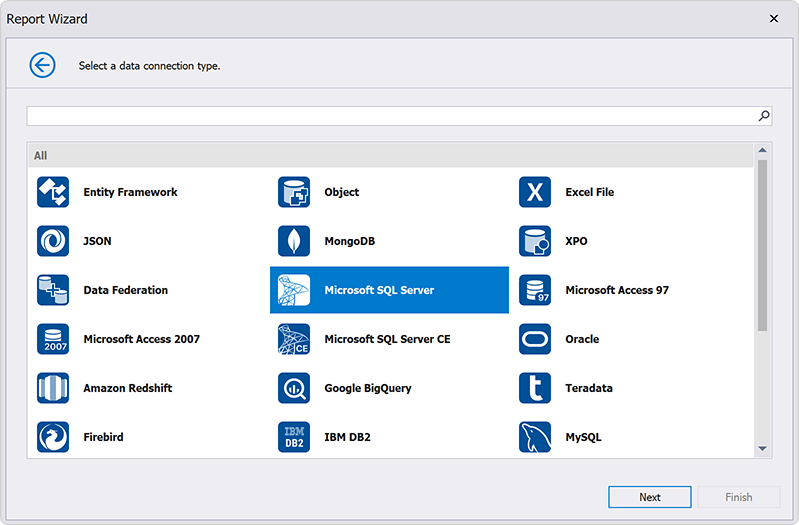
Data binding connects a report to a data source (such as a SQL database, Entity Framework model, JSON/XML, MongoDB, Data Federation, business objects, and Excel/CSV).
DevExpress Reports supports:
- Design-time and runtime data configuration
- Multiple data sources in a single report
- Federated and composite data models
Report Controls
Report controls render content. DevExpress Reports includes over 20 built-in report controls and UI elements to help you deliver interactive and data-rich reports (charts, cross-tabs and pivot tables, subreports, shapes, barcodes, table of contents, etc.). You can also use custom report controls, DevExpress UI controls, or third-party controls.
Refer to the following help topics for additional information:
- Introduction to Report Controls
- Add Controls to a Report
- Bind Report Controls to Data
- Customize and Manage Report Controls (Copy, Move, Reuse)
- Create and Use Custom Report Controls
- Display Third-Party and DevExpress UI Controls in Reports (WinForms, ASP.NET)
Report Parameters
What Are Report Parameters?
Report parameters enable dynamic control over report output. Use parameters to filter data, adjust calculations, and customize report content at runtime.
Report parameters support:
- Static-value or multi-value selection
- Static or dynamically generated values
- Cascading parameters
- Date range parameters (
DateTime,DateOnly,TimeOnly)
Refer to the following help topics for additional information:
What Parameter Types Are Supported?
DevExpress Reports supports the following parameter data types:
- String
- Date and Time
- Numeric
- Boolean
- GUID
You can also register and use custom parameter types when built-in types do not meet your requirements.
What Is a Multi-Value Parameter?
A multi-value parameter is a report parameter that accepts multiple values instead of a single value. Enable the MultiValue option to change the parameter type to an array.
How to Reference Report Parameters?
You can reference parameters in:
- Calculated fields
- Control property expressions
- Data source queries
- Expression bindings
- Filter strings
Refer to the following help topics for additional information:
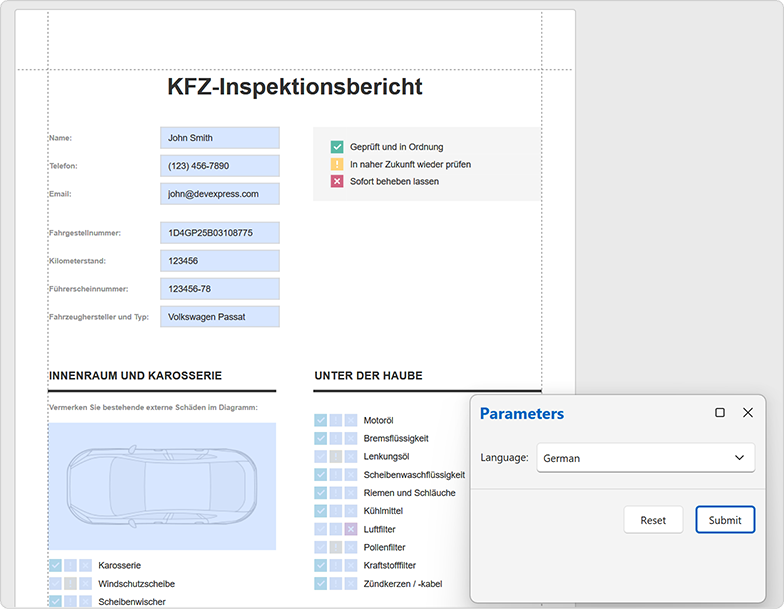
What Is the Parameters Panel?
The Parameters Panel allows users to enter or modify parameter values. The panel is displayed in the Document Viewer (Print Preview).

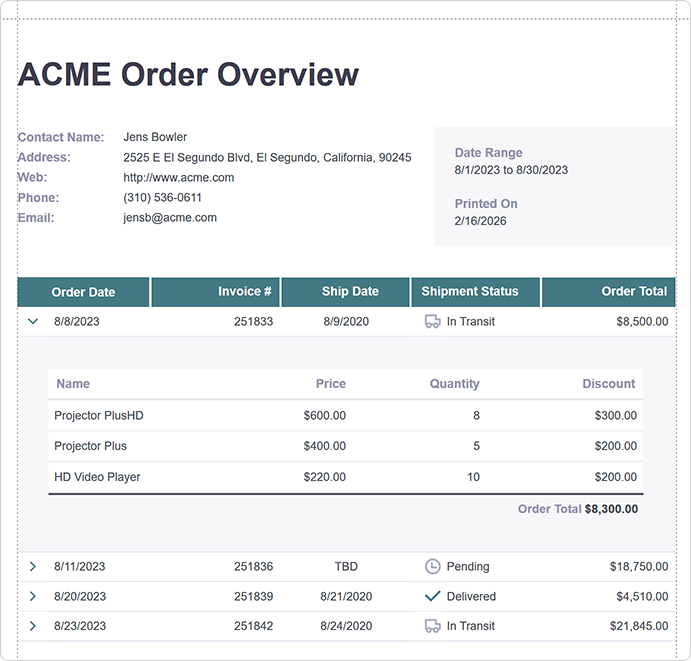
Interactivity
Interactive reports enable users to engage directly with report content in preview mode.
Reports can respond to the following built-in interactions:
You can handle mouse events in preview mode and implement custom interactions that make reports more dynamic and engaging. Refer to the following help topic for additional information: Event-Based Report Interaction (Mouse Events).
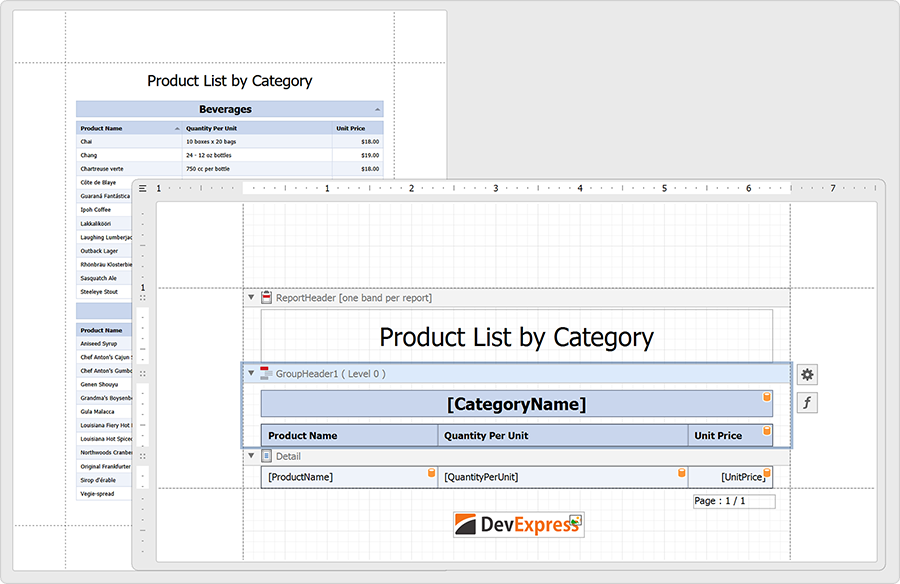
Data Shaping and Analytics
Data shaping enables you to transform source data to visualize it within a report.
Refer to the following help topics for information on available data shaping and data analysis options:
- Calculate Summaries & Aggregates
- Define Calculated Fields
- Filter Data
- Format Values
- Group and Sort Data
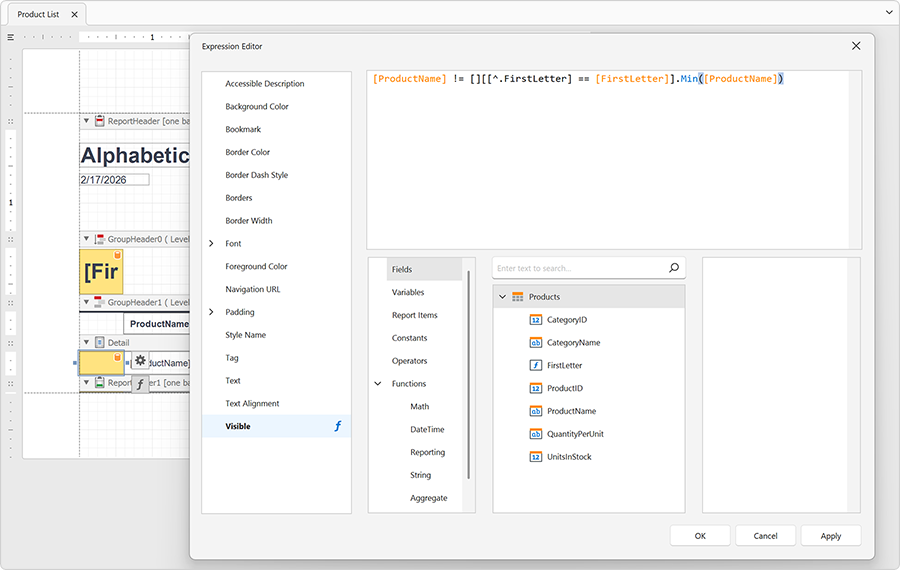
Expressions
Expressions allow you to bind report controls to data, calculate values and summaries, and conditionally format controls.
Advanced usage scenarios include:
- Access report element properties
- Use row/column indexes, parent relations, and event-related variables to create data-driven and interactive report behavior
Refer to the following help topics for additional information:
- Introduction to Report Expressions
- Construct Expressions
- Bind Expressions to Data
- Use Functions in Expressions
What Is the DevExpress Expression Engine?
The Expression Engine evaluates declarative logic for formatting, filtering, calculations, and conditional behavior.
Refer to the following help topic for additional information: Report Expression Syntax.
Common Tasks and Examples
- Compute Totals and Aggregates
- Conditionally Modify Control Appearance
- Conditionally Hide or Display Report Controls
- Filter Data Based on Custom Criteria
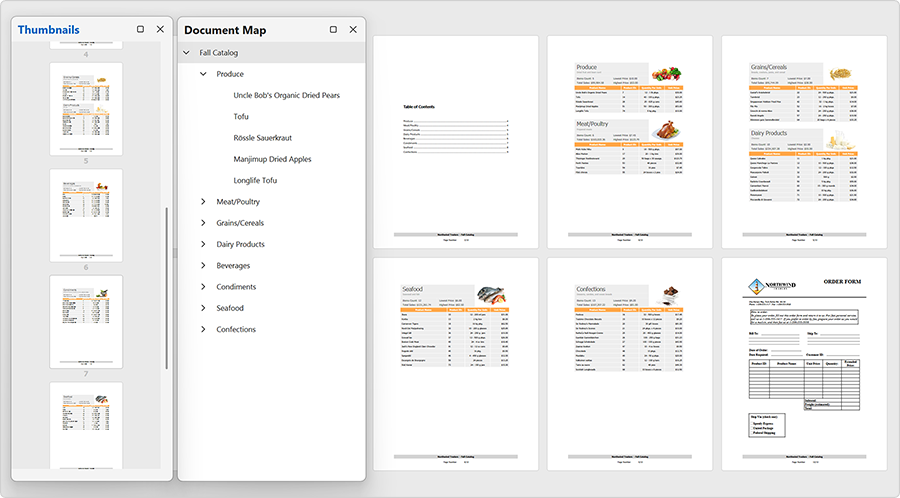
Navigation
Navigation features help users move through complex or multi-page reports, especially when working with large datasets or hierarchical content.
Refer to the following help topics for additional information:
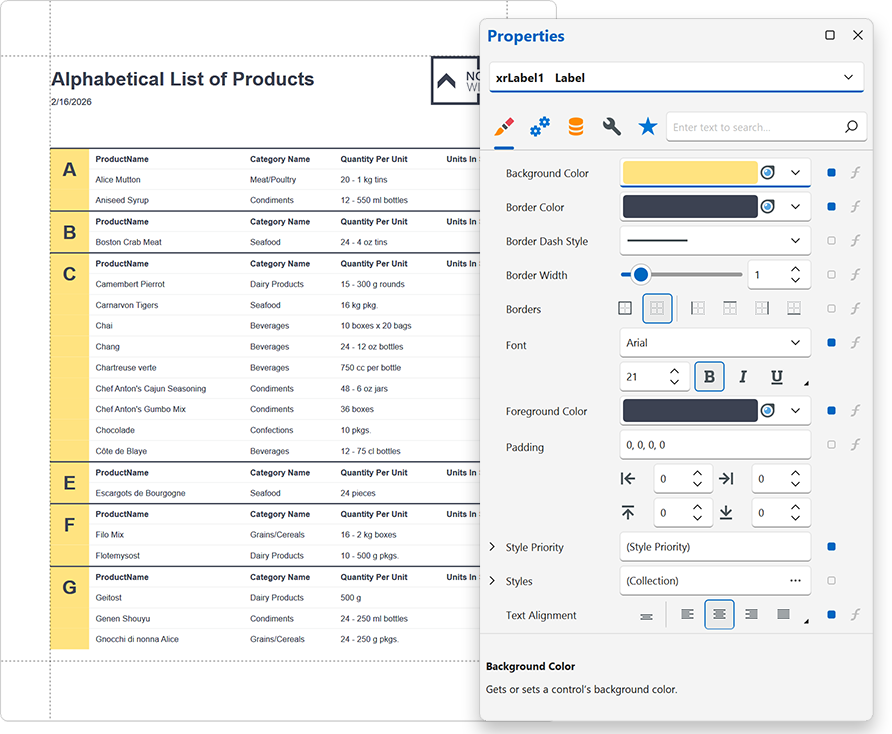
Appearance
Appearance settings define how report content looks when rendered. Each report element exposes a set of appearance properties (for example, BackColor, ForeColor, Font, Borders, Padding) that define its visual presentation. When you place a control inside a band, the control inherits band appearance settings unless explicitly overridden.
Appearance settings support inheritance, styles, and priority rules to ensure consistent and maintainable visual design.
Refer to the following help topics for additional information:
Report Serialization and Distribution
DevExpress Reports introduces flexible options to store report definitions, generate documents, and distribute output across platforms. The reporting workflow separates a report’s design (layout) from its generated result (document), which allows you to maintain reusable templates and publish finalized content independently.
What Is the Difference Between Report Layout and Report Document?
- Report Layout (.REPX)
A report layout defines the structure, data configuration, and visual design of a report. It includes bands, controls, data bindings, formatting, parameters, expressions, and styles. Layout files can be saved, shared, reused across applications, and modified in the Report Designer. REPX files do not store actual data — only the report definition.
- Report Document (.PRNX)
A report document is a generated output that you can serialize in PRNX format. You can store a PRNX document in a file, database, or any other storage.
A PRNX file is a snapshot of a document created from a report layout and its data at a specific point in time. It contains fully rendered pages and does not maintain a connection to the original data source. The document cannot be redesigned and does not reflect data changes that occur after generation.
PRNX documents are appropriate for caching scenarios. You can load a PRNX file into a Document Viewer to preview, export, or print the document without report layout regeneration.
How Are Report Layouts Stored?
Report layouts can be saved and shared across applications and projects for reuse, version control, and team collaboration. REPX files can be stored locally, in external storage, or in centralized repositories (such as databases or cloud-based storage systems). Newer DevExpress versions can open layout files created in previous versions.
How Are Reports Stored in a Visual Studio Project?
When you add a DevExpress Report to a Visual Studio project, the report is stored as a set of project files using the recommended CS/VB file format.
This format includes:
- ReportName.Designer.cs (.vb) – Contains the report layout serialized in CodeDOM. The designer updates this file automatically when you modify the report.
- ReportName.cs (.vb) – Contains custom code (for example, event handlers and application logic).
- ReportName.resx – Stores report resources.
The CS/VB format integrates directly into the project structure and supports source control systems.
Refer to the following help topic for additional information: Report File Formats (CS/VB).
How Safe Is Report Serialization and Deserialization?
DevExpress Reports implements secure mechanisms for report serialization and deserialization. Report layouts can be safely stored and shared across applications and users. Use XML serialization to prevent execution of malicious code and avoid legacy CodeDOM serialization unless explicitly required.
Refer to the following help topics for security-related information:
Localization
Localization features allow you to do the following:
- Translate Report Content
- Translate Report Content with AI
- Use Satellite Assemblies
- Configure Right-to-Left Layout
- Adjust Measurement Units
AI-powered Extensions
DevExpress Reports includes AI-powered extensions that allow you to incorporate advanced natural language processing (NLP) capabilities in desktop and web reporting. These features help you localize content, generate expressions from prompts, preview test data, and translate or summarize reports.
AI functionality is available across WinForms, WPF, Web, Visual Studio Report Designers, and Document Viewers.

Refer to the following help topic for additional information: AI-powered Extensions for DevExpress Reports.
How Can AI Help Design Reports in Visual Studio?
AI-powered Report Generation allows you to create report layouts directly within the Visual Studio Report Designer. With the DevExpress AI-powered Assistant, you can connect to Azure OpenAI or OpenAI services and automatically generate reports based on natural language prompts. You can review, modify, and enhance AI-generated reports.
How Can AI Localize and Translate Reports Across Platforms?
Refer to the following help topic to explore AI-powered extensions for automatic report localization and inline translation:
- AI-powered Report Localization in Web Report Designer
- AI-powered Report Localization in WinForms Report Designer
- AI-powered Report Localization in WPF Report Designer
- AI-powered Report Localization in Visual Studio Designer
- Translate Reports Inline in WinForms Document Viewer
How Can AI Generate Expressions?
Use natural language prompts to create expressions in desktop, web, and Visual Studio Report Designers:
- Generate Expressions from Prompts in Web Report Designer
- Generate Expressions from Prompts in WinForms Report Designer
- Generate Expressions from Prompts in Visual Studio Designer
How Do I Preview Reports with AI-Generated Test Data?
Leverage AI to populate sample data and test reports in Report Designers for WinForms, WPF, Web, and Visual Studio before publishing:
- Preview Reports with AI-generated Test Data in Web Report Designer
- Preview Reports with AI-generated Test Data in WinForms Report Designer
- Preview Reports with AI-generated Test Data in WPF Report Designer
- Preview Reports with AI-generated Test Data in Visual Studio Report Designer
Create Reports in Code
You can create any report that you design visually in code as well. The Reporting API exposes the same object model as the Report Designer. Report generation classes allow you to construct, configure, and customize reports programmatically across all supported platforms.
Examples
DevExpress offers a comprehensive collection of reporting examples that demonstrate common scenarios, integration patterns, and platform-specific best practices. These examples help you configure reporting components, connect data sources, integrate viewers and designers, and implement secure and scalable solutions across supported platforms.
Explore 700+ reporting examples in the official GitHub repository: DevExpress Reporting Examples.
Featured examples:
- ASP.NET Core Reporting — Best Practices
- ASP.NET Core Reporting — Integrate the .NET Aspire Dashboard
- WinForms Reporting — Bind a Report to a SQL Data Source at Runtime
- Blazor WebAssembly Reporting — .NET Integration with Node.js
- Blazor Server Reporting — JavaScript-Based Controls Integration
- React Reporting — Add the Web Document Viewer (Vite)
End-User Report Designer Feature Guides
DevExpress Reports includes a fully customizable and embeddable End-User Report Designer that allows users to create and modify reports at runtime, with functionality comparable to the Visual Studio Report Designer. Users have access to most report design tools, including layout configuration, data binding, expressions, parameters, scripting, conditional formatting, and interactive preview.
Reporting features may vary by platform. Refer to our End-User Documentation for platform-specific capabilities and supported features:
- End-User Report Designer for Web
- End-User Report Designer for WinForms
- End-User Report Designer for WPF