Chart Control
- 2 minutes to read
The DevExpress ChartControl for WinForms is a powerful visualization tool that helps you display your data as bars, areas, lines and many other forms.
| This section contains tutorials that are intended to help first-time users get acquainted with the DevExpress ChartControl for WinForms. |
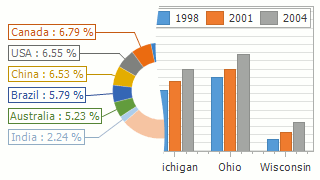
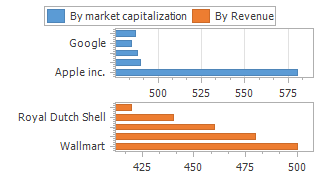
| The Chart control supports a wide variety of series views, for example areas, bars, lines and others. In addition, you can use the Chart control to visualize financial data and also to plot Gantt diagrams. The Chart Elements section contains information about all the chart elements. |
| The Chart control allows you to provide data in several different ways. First, you can manually create a series, and then populate points manually or automatically generate data from a data source. Second, it is possible to automatically generate series using the series template. Also, the Chart control supports data aggregation and color providing. In addition, you can configure the data representation using, for example, data filtering and sorting. |
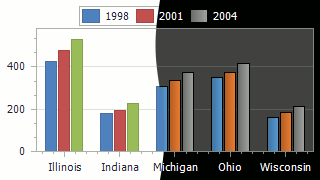
| The Chart control is shipped with several predefined appearances and palettes allowing you to customize the chart’s outward appearance per your needs. If out of the box chart appearance customization features do not meet your expectations, the Chart control supports the custom draw events. |
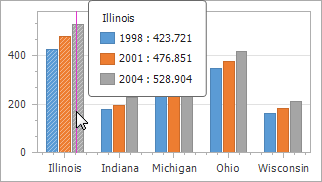
| In addition to the basic end-user interaction, the Chart control supports the following interaction features. |
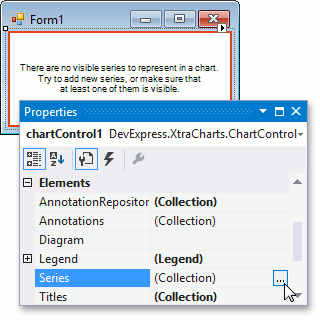
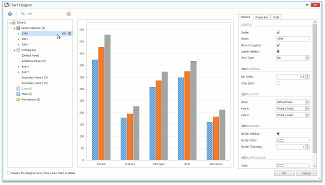
| The Chart control can be easily and rapidly customized using the Chart Designer and Pattern Editor. |