Animation
- 4 minutes to read
All 2D series view types support animation.
Overview
There are two approaches to applying animation effects to the series.
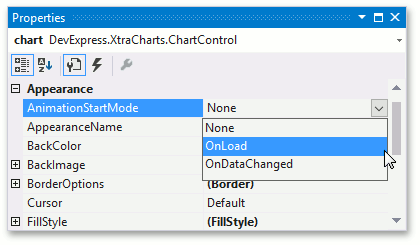
Turn on automatic animation on data changing or chart loading by setting the ChartControl.AnimationStartMode property to OnDataChanged or OnLoad.
Manually start animation using the ChartControl.Animate method.
There are two types of animation: series animation and series point animation. The AnimationBase class descendants represent all animations.
The Bar, Bubble, Financial, Funnel, Gantt, Point, Pie and Donut, Polar Point and Radar Point series views support series point animation only.
It is possible to specify animations’ start time using the AnimationBase.BeginTime property, and the duration using AnimationBase.Duration.
An easing function, which specifies the rate of change of animation progress over time, can be set using the AnimationBase.EasingFunction for all animations. For example, the following image shows a chart animated using BounceEasingFunction with EasingFunctionBase.EasingMode set to Out:
Refer to the Easing Functions document for more information on Easing Functions.
Series Animation
These type of animations influence series whose views represent points as united objects, for example, line.
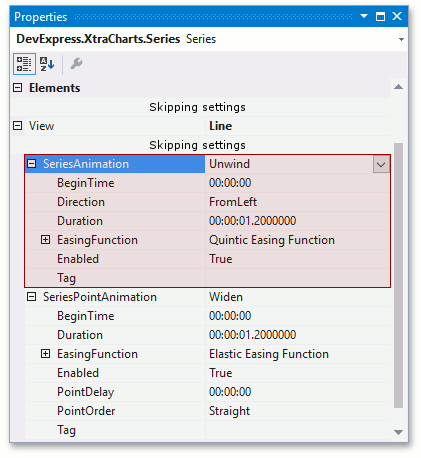
An animation of this type is specified using a series view’s SeriesAnimation property.
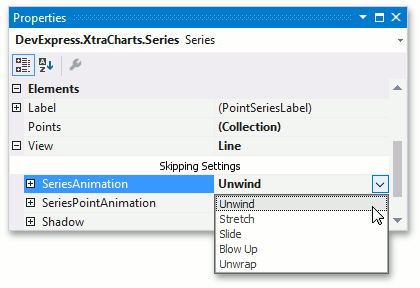
The following code demonstrates how to set the Unwind animation to a series with the line view:
Series series = chart.Series["Africa"];
LineSeriesView view = series.View as LineSeriesView;
if (view != null) {
    view.SeriesAnimation = new XYSeriesUnwindAnimation {
        Direction = AnimationDirection.FromBottom
    };
}
The table below lists animations, grouped by the series view, to which these animations can be applied.
Series Views | Supported Animation Types |
|---|---|
Series Point Animation
This group’s animations are applied independently to each point. In addition to default animation settings, these animations have properties that allow you to configure point animation order and the delay between point animation start times.
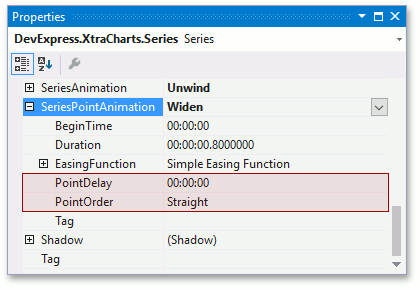
Note that series point animation is specified using properties with different names for different view types. The property specifying the series point animation is SeriesPointAnimation for views supporting series animation, and a series view without series animation has the Animation property that allows you to set point animation.
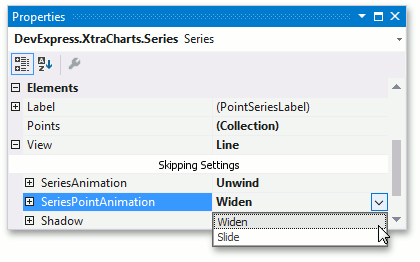
The following code demonstrates how to set the Widen point animation to a series with the line view:
Series series = chart.Series["Africa"];
LineSeriesView view = series.View as LineSeriesView;
if (view != null) {
    view.SeriesPointAnimation = new XYMarkerWidenAnimation {
        PointDelay = new TimeSpan(0, 0, 0, 0, 25)
    };
}
The table below represents animations, grouped by series views, to which this animation can be applied.
Series Views | Supported Animation Types |
|---|---|
Areas (except Stacked) | |
Indicator Animation
These types of animations influence series indicators.
The Indicator.Animation property specifies an animation of this type.
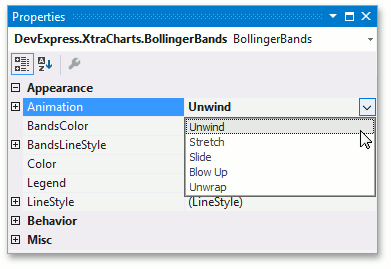
The following code demonstrates how to set the Unwind animation to a series with the line view:
Indicator massIndex = new MassIndex {
    Animation = IndicatorUnwindAnimation {
        Direction = AnimationDirection.FromBottom
    }
};
financialView.Indicators.Add(massIndex);
The list below contains animations available for indicators.