Choose a Palette for Painting Series, Points and Indicators
- 2 minutes to read
This document describes how to select a palette for painting a chart’s series (or their individual points). The same steps will define an individual palette for painting a chart’s indicators.
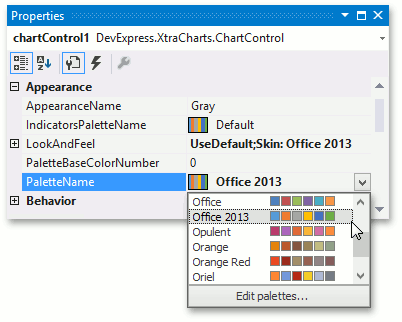
You can choose a pre-composed palette for painting a chart’s series or their points via the ChartControl.PaletteName property.
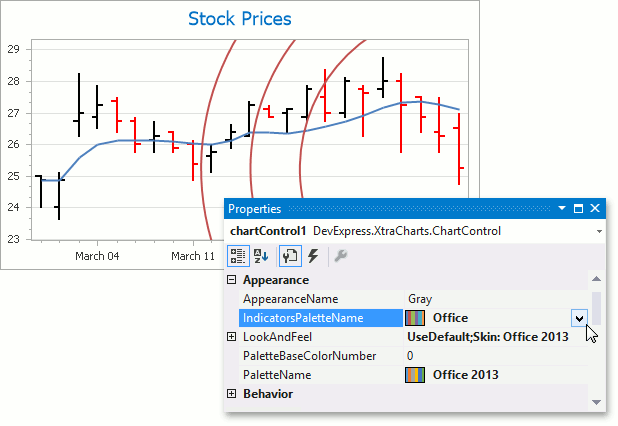
To define a similar palette for all the chart’s indicators, use the ChartControl.IndicatorsPaletteName property.
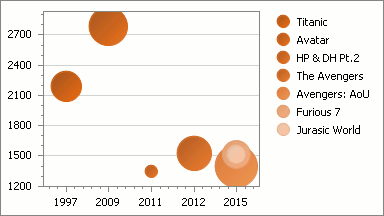
The following images demonstrate a chart with different palettes (using the Light appearance ). For the complete list of pre-composed palettes, see PaletteRepository.PaletteNames.
| The property’s value | Resulting image |
|---|---|
| ChartControl.PaletteName = Aspect | 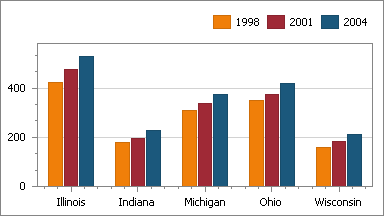 |
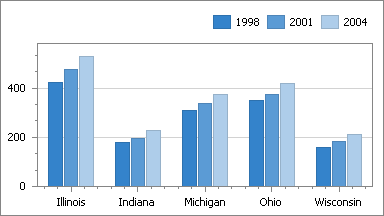
| ChartControl.PaletteName = Office | 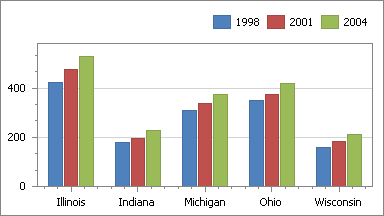 |
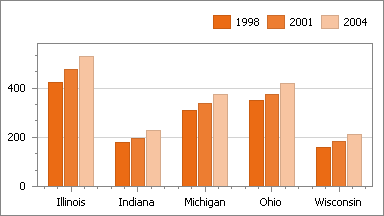
| ChartControl.PaletteName = Office 2013 | 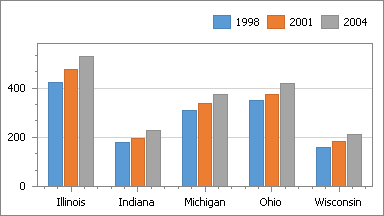 |
Additionally, within the selected palette, you can specify the base color of this palette, to assign a spectrum based on this color. The base color is specified by an integer value of the ChartControl.PaletteBaseColorNumber property. Its effect is demonstrated in the following image (with an example of the Concourse palette).
The properties’ values | Resulting image |
|---|---|
ChartControl.PaletteName = Office 2013 |
|
ChartControl.PaletteName = Office 2013 |
|
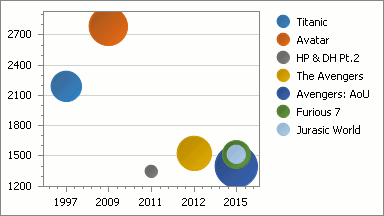
When the ChartControl.PaletteBaseColorNumber property is set to 0 and the SeriesViewColorEachSupportBase.ColorEach property of a series is enabled, the palette is used to paint the individual points of that series.
When a palette base color number is not equal to 0, the SeriesViewColorEachSupportBase.ColorEach property paints series points based on a composition of the specified color.
The property’s value | Resulting image |
|---|---|
ColorEach = true PaletteBaseColorNumber = 0 |
|
ColorEach = true PaletteBaseColorNumber = 2 |
|
When none of the demonstrated approaches provide the desired result, you have the option to create your own palette.
In addition, you can enable your end-users to choose palettes and appearances for a chart themselves. Refer to the Chart Ribbon and Toolbars help topic for more information.