Data Grid
- 12 minutes to read
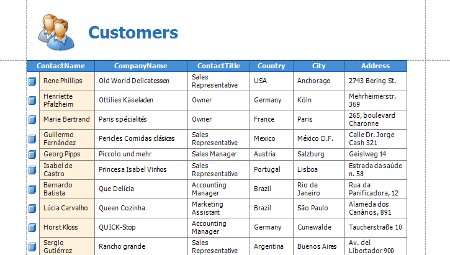
The WinForms Data Grid (GridControl) provides rich capabilities for displaying, shaping and editing data from any data source. You can choose between the following data presentation formats (Views) in the Data Grid.
- Traditional tabular format (Grid View)
- Banded tabular format (Banded Grid View and Advanced Banded Grid View).
- Cards (Layout View and Card View)
- Tiles (Tile View)
- Windows Explorer-inspired style (WinExplorer View)
Data shaping capabilities include, but are not limited to, sorting, grouping, summary calculation, cell merging, data editing, master-detail and split presentations, as well as a rich set of filtering and data searching options such as built-in column filters and Find Panel.
You can bind to all traditional data sources. To work with large data sources, use dedicated synchronous and asynchronous server modes.
Get Started With Data Grid and Views
Introduces the Grid Control and its data presentation formats - Views. You will learn about the capabilities provided by Views, how to switch between Views, provide data, and customize the layout of columns, bands and card fields.Included Components
In addition to the GridControl component, the Data Grid Suite also includes two GridControl-based lookup editors and the control that supports the grid’s split presentation feature. Refer to the link to see a list of included components.Visual Elements
Demonstrates visual elements that the Grid Control and its Views are composed of.Examples
Contains a large variety of task-based examples.
Bind to Data
To display data within the Data Grid, you first need to bind it to a data source. The following data binding modes are supported.
- Bind to Multiple Data Source Types
- ADO.NET data sets
- SQL data
- Entity Framework data
- XML data
- Excel data sources
- LinQ To SQL
- WCF Data Services
- DevExpress ORM Tool (XPO)
- Lists or arrays of objects created in code
- Synchronous and Asynchronous Server Modes[1]
- Unbound Columns[2]
View Technology
The Data Grid control uses Views to present data from a bound data source. The Views specify how records and record fields are arranged. They provide multiple edit, display, behavior and appearance options. Choose one of the following View types to render data per your needs.
Grid View
Banded Grid View
Advanced Banded Grid View
Card View
Layout View

WinExplorer View

Tile View
- Grid View - Displays data in a tabular form.
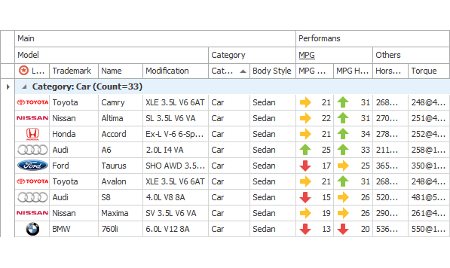
- Banded Grid View - Displays data in a tabular form and allows grouping of columns into bands.
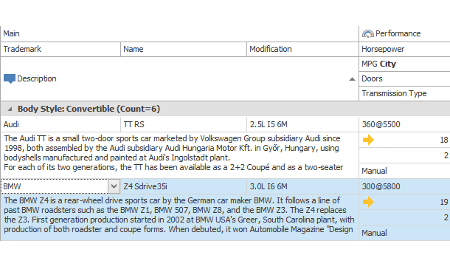
- Advanced Banded Grid View - Displays data in a tabular form, allows grouping columns into bands and supports complex data cell arrangements.
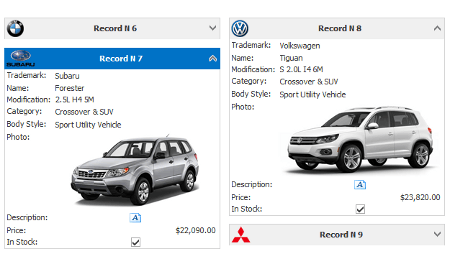
- Layout View - Presents records as cards, which can be displayed in one or multiple columns, one or multiple rows, in an ellipse (carousel mode) or a single card at a time. Supports complex card field layouts, built-in groups, tabbed groups and labels.
- Card View - Presents data records as cards, arranged down and then across. Card fields are always arranged in a single column.
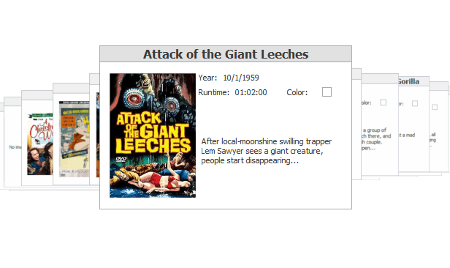
- WinExplorer View - Displays records using one of seven styles supported by MS Windows Explorer - Small, Medium, Large, Extra Large, List, Tiles and Content.
- Tile View - Displays records as read-only tiles, using one of the following layout modes: default (one or multiple columns/rows), list (without spaces between records) and Kanban. This View provides the advanced field positioning feature, which helps you arrange fields relative to other fields, specify absolute or relative field display bounds, etc.
Grid View Data Layout
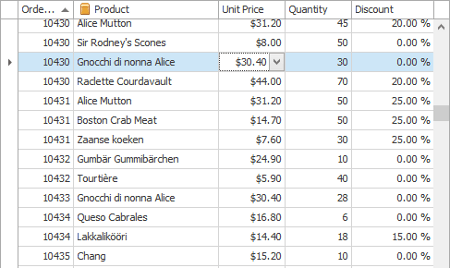
The most traditional tabular format, encapsulated by the Grid View, presents data source fields as columns and data source records as rows. The following are only a subset of the features supported by the grid layout.
- Column re-size and re-arrange by end-users
- Column auto-width and best fit features
- Fixed columns (frozen panes)
- Split presentation
- Row preview sections
- Cell merge
- Horizontal and vertical scrolling
- Auto and custom row height
- Runtime row resize
Grouping
You and your end-users can group data against one or multiple columns in Grid Views, Banded Grid Views and Advanced Banded Grid Views.
- An end-user can group data at runtime by dragging a column to a dedicated Group Panel.
- Data group modes: by column values or display text.
- Group date-time values by years, months, or into common date intervals (Today, Tomorrow, Sunday, Monday, Tuesday, Next Week, Next Month, Last Week, Last Month, etc.).
- Implement custom grouping with an event.
- Fixed group rows.
- API to process group rows.
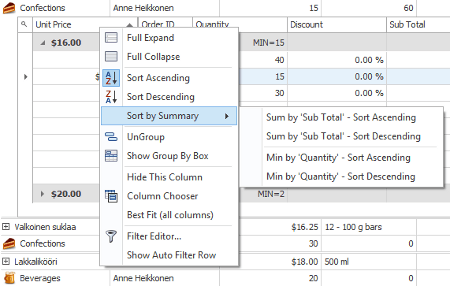
- Sort grouped data by summary values.
Sorting
To specify the order of records in the Data Grid, sort data by one or more columns.
- An end-user can sort data at runtime (in Grid Views, Banded Grid Views, Advanced Banded Grid Views, Layout Views, and Card Views).
- The Data Grid sorts its data itself and does not delegate this functionality to the underlying data source (except for server modes).
- Sort by values or display text.
- Implement custom sorting algorithms using an event.
- Sort grouped data by summary values.
Summaries
Grid Views, Banded Grid Views and Advanced Banded Grid Views allow you to calculate multiple summary functions: the number of records, the maximum column value, a sum of column values, custom function, etc.
- Total summaries (calculated against all rows)
- Group summaries (calculated against grouped data).
- Manual summary calculation
- Select a summary function at runtime using a context menu
- Multiple total summaries for a single column
- Display group summaries in footers and group rows
- Obtain and formatting summary values
- Sort grouped data by summary values
Edit Data
In the Data Grid, you can specify the way column values are presented and edited by assigning DevExpress editors to columns. An end-user can edit records in-place and within a separate edit form. If a data source supports record adding and removing, you can perform record management in code and using a standalone or embedded Data Navigator control.
- Add and remov rows, in code and using a Data Navigator control
- Edit data with the help of 35+ in-place editors
- Edit data in a standalone (modal) or in-line edit form
- Modify data in code
- Input validation
- Multiple editors per column
Filter and Locate Rows
Multiple ways to filter and locate rows is supported. An end-user can search for data using a dedicated Find Panel (press CTRL+F) or using the incremental search feature. Filter criteria created in code or at runtime allow you to narrow the displayed record set.
- Built-in Find Panel
- An end-user can filter data with column filter dropdowns
- Regular and MS Excel-inspired filter dropdowns
- Filter history
- Filter editor (for creating complex filter criteria)
- Incremental search
- The built-in filter row
- Filter and locate rows API
- Manage row visibility using an event
Focus and Selection
In the Data Grid control, an end-user can navigate between cells (move cell focus) using the mouse and keyboard. With a dedicated option, you can prevent certain column cells from being focused.
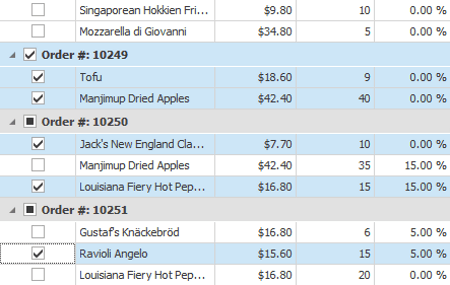
Row/card and cell selection can also be performed using the mouse and keyboard. In addition, to select rows in Grid Views, you can use the built-in Check column (displays checkboxes within rows).
Multiple Row and Cell Selection
Provides information on single row selection, multiple row selection and multiple cell selection modes.Multiple Row Selection via Built-In Check Column and Selection Binding
The built-in Check column provides an intuitive way to select rows with check boxes.Focus Cells
Shows how to move focus between cells at runtime, and how to specify a focused cell’s appearance.Move Row Focus
Covers methods that enable you to move row focus by a specified number of rows forward or backward.Navigators
Describes navigator controls that allow end-users to browse through the grid control’s data and add/delete records.
Text Formatting
To format column values in a specific manner in display and edit modes, you can assign a certain DevExpress in-place editor to the column. Column in-place editors automatically format cell values according to the editor’s type and settings. If default text formatting does not suit your needs, you can provide custom display text or format cell values using HTML and various format patterns.
- Format Cell Values
Shows how to format cell display text using HTML tags, events, masks and the standard .NET formatting mechanism.
Master-Detail
The Data Grid supports hierarchical data sources, which consist of master and detail tables (lists) linked by one-to-many relationships. Master tables can be presented by Grid Views, Banded Grid Views or Advanced Banded Grid Views, while detail tables can be presented by any of the available Views.
If records in the bound data source provide a property (or properties) of a collection type, the Data Grid automatically enables master-detail mode to render these collections.
For data sources that do not provide built-in capabilities to organize master-detail relationships on the data layer, you can realize master-detail mode using one of two approaches: implement the IRelationList interface for your data source or handle the grid control’s dedicated events.
Print and Export
The Grid Control’s data can be printed and exported to multiple formats. When exporting to MS Excel format, you can enable the data-aware export mode, which is optimized for subsequent analysis of grid data within Microsoft Excel.
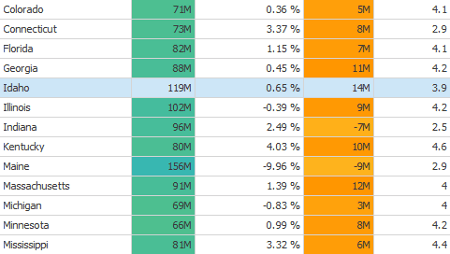
Appearance and Conditional Formatting
You can change the Data Grid’s look-and-feel by applying one of the many skins. The Appearance mechanism allows you to change the colors and fonts of certain grid elements (grid columns, focused row, etc.). If you wish to highlight critical information, identify trends and compare data between cells, use the Conditional Formatting feature.
More Features
Rows
Demonstrates two row traversing techniques - traversing through data rows and currently visible rows.Asynchronous Image Load in WinExplorer and Tile Views
By default, the Data Grid loads all data from its data source before showing it on screen. If your grid records contain images, you can speed up the application performance and make the startup feel smoother by enabling the Asynchronous Image Load feature. In this mode, the grid loads its textual data first and immediately displays it. Images are loaded in a separate thread and displayed one by one using optional visual effects.Batch Modifications
Batch modifications are designed to speed up the grid control’s performance by eliminating superfluous updates (visual, re-sorting, selection updates, etc.). The main objective is to update the View only once - after all the necessary changes have been made.Save and Restore Layout
The term “layout” encompasses all the settings that control the visibility and size of visual elements, their appearance settings, filter, sorting, grouping and summary information, etc. The Grid Control provides methods to save the layout to a data store (an XML file, stream or the system registry) and then to restore it. This gives you the capability to save layouts between application runs.Hit Information
There are times when you may need to recognize which element is located at the specified screen coordinates in applications. For instance, you may have to determine which part of a View the user has clicked or double-clicked. For this purpose, Views provide the CalcHitInfo method, which accepts a point measured in grid control client coordinates and returns a Hit Info object containing information on the View element at this point.Hints
When an end-user hovers with the mouse over a visual element (e.g., column or band header) with truncated text, a hint showing complete text is displayed. This section explains how to modify default hints and add your own ones.Popup Menus
The Data Grid supports built-in popup menus for column headers, row footers, and the group panel. When required, you can add your own popup menus for any grid element or customize the existing menus.
Design-Time Features
Design-time tools speed up the design process of the Data Grid control, and even allow you to create a working application from scratch without writing a single line of code.
Level Designer
The Level Designer helps you to provide Views to display your data, and to easily access these View settings at design time. For hierarchical data sources, it allows you to assign a View for each data level.Grid Designer
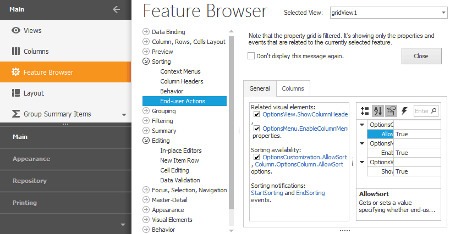
The advanced Grid Designer enables you to customize Views, bands, columns, summaries, in-place editors, appearance settings, layout and other options. The Feature Browser page gathers options and events provided by Views and columns into a set of categories (features). This is the best starting point to find the settings and events related to a specific functionality.On-form Band and Column Customization
See this topic to learn about design-time on-form customization of column and band layouts supported by Grid Views, Banded Grid Views and Advanced Banded Grid Views.
End-User Capabilities
Topics in this section cover operations available to end-users at runtime.
- Data editing
- Controlling column, band and card field visibility
- Re-arranging and resizing columns and bands
- Filtering, sorting and grouping data
- Applying summaries
- Using the Find Panel and Incremental Search feature to locate rows, etc.
-
Server modes are used for large data sets. Even if your data source contains millions of records, the control’s performance is still high due to loading records in small portions on demand, and performing data-related operations (such as sort, filter and summary calculation) on the server side. These modes succesfully replace data pagination used in data-aware controls from other vendors. See this help topic for more details: Large Data Sources: Server and Instant Feedback Modes.
-
Unbound columns allow you to display custom data in the grid. Values for these columns can be calculated according to an expression or using an event.