Gantt Control
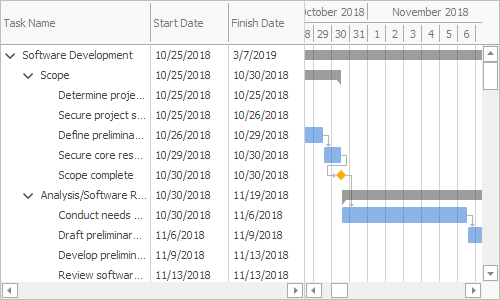
The GanttControl represents a Gantt chart — a bar chart that illustrates a project schedule. The control consists of a task list and a chart that shows task start and finish dates, progress, and dependencies.
Learn the Basics
|
|
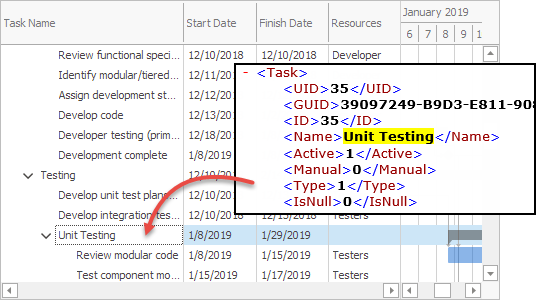
Data Source
|
|
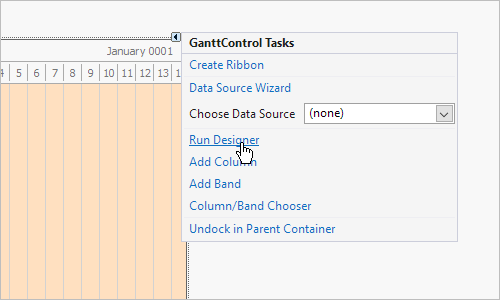
Customization
|
|