ChartBase.ToolTipEnabled Property
Gets or sets whether to show tooltips when a user clicks a series or series point.
Namespace: DevExpress.WinUI.Charts
Assembly: DevExpress.WinUI.Charts.v22.1.dll
NuGet Package: DevExpress.WinUI
Declaration
Property Value
| Type | Description |
|---|---|
| Boolean | true if tooltips are enabled; false if tooltips are disabled. |
Remarks
Use the ToolTipEnabled property to activate (deactivate) tooltips at the level of the chart (CartesianChart or PieChart).
The following properties specify the content and appearance of tooltips that are shown when a user clicks a continuous series (for example, a line series or area series):
The following properties specify the content and appearance of tooltips that are shown when a user clicks a series point marker:
Example
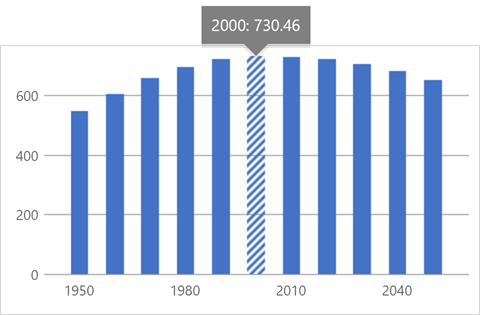
This example customizes the appearance and content of tooltips that are shown when a user clicks a bar.
<Page.Resources>
    <ResourceDictionary>
        <DataTemplate
        x:Key="toolTipTemplate">
            <Grid x:Name="Tooltip"
                    HorizontalAlignment="Center"
                    VerticalAlignment="Center"
                    UseLayoutRounding="True">
                <Grid x:Name="Shadow"
                        Margin="0,4,0,-4"
                        Opacity="0.1">
                    <Grid.RowDefinitions>
                        <RowDefinition Height="*" />
                        <RowDefinition Height="12" />
                    </Grid.RowDefinitions>
                    <Path x:Name="Arrow"
                            Stretch="Fill"
                            Fill="Black"
                            Data="F1 M 461,303L 474,316L 487,303L 461,303 Z "
                            HorizontalAlignment="Center"
                            Height="13"
                            Grid.Row="1"
                            Width="26"
                            Margin="0,-1,0,0" />
                    <Border x:Name="ContentBack"
                            Background="Black" />
                </Grid>
                <Grid>
                    <Grid.RowDefinitions>
                        <RowDefinition Height="*" />
                        <RowDefinition Height="12" />
                    </Grid.RowDefinitions>
                    <Path x:Name="Arrow1"
                            Stretch="Fill"
                            Fill="Gray"
                            Data="F1 M 461,303L 474,316L 487,303L 461,303 Z "
                            HorizontalAlignment="Center"
                            Height="13"
                            Grid.Row="1"
                            Width="26"
                            Margin="0,-1,0,0" />
                    <Border x:Name="ContentBack1"
                            Background="Gray" />
                    <TextBlock x:Name="Content1"
                                TextWrapping="Wrap"
                                Text="{Binding ToolTipText}"
                                Margin="10, 7.5, 10, 9"
                                FontSize="16"
                                Foreground="White" />
                </Grid>
            </Grid>
        </DataTemplate>
    </ResourceDictionary>
</Page.Resources>
<Grid>
    <Charts:CartesianChart ToolTipEnabled="True">
        <Charts:CartesianChart.Series>
            <Charts:Series>
                <Charts:Series.View>
                    <Charts:BarSeriesView
                                    ToolTipPointPattern="{}{A}:{V:f2}"
                                    ToolTipPointTemplate="{StaticResource toolTipTemplate}"/>
                </Charts:Series.View>
                <!-...-->
            </Charts:Series>
        </Charts:CartesianChart.Series>
    </Charts:CartesianChart>
</Grid>