Data Point Markers
Markers indicate data points on the chart area. You can display point markers for line, point, and area series.
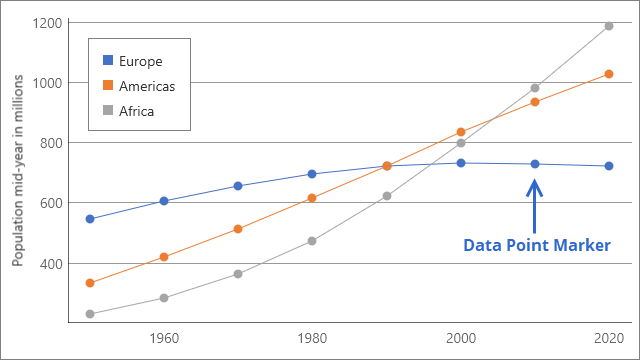
The following example uses the LineSeriesViewBase.ShowMarkers property to show markers and the LineSeriesViewBase.MarkerSize property to specify their size:
<Charts:CartesianChart x:Name="chart">
    <!--...-->
    <Charts:CartesianChart.Series>
        <Charts:Series x:Name="seriesEurope">
            <Charts:Series.View>
                <Charts:LineSeriesView ShowMarkers="True"
                                       MarkerSize="9"/>
            </Charts:Series.View>
            <Charts:Series.Data>
                    <!--...-->
            </Charts:Series.Data>
        </Charts:Series>
        <!--...-->
    </Charts:CartesianChart.Series>
</Charts:CartesianChart>