ChartRangeControlClient Class
Displays the bound chart’s data within the range control and specifies the chart’s visual range.
Namespace: DevExpress.WinUI.Charts
Assembly: DevExpress.WinUI.Charts.v22.1.dll
NuGet Package: DevExpress.WinUI
Declaration
public class ChartRangeControlClient :
    Canvas,
    IRangeControlClient,
IVirtualSurfaceDrawingCallbackRemarks
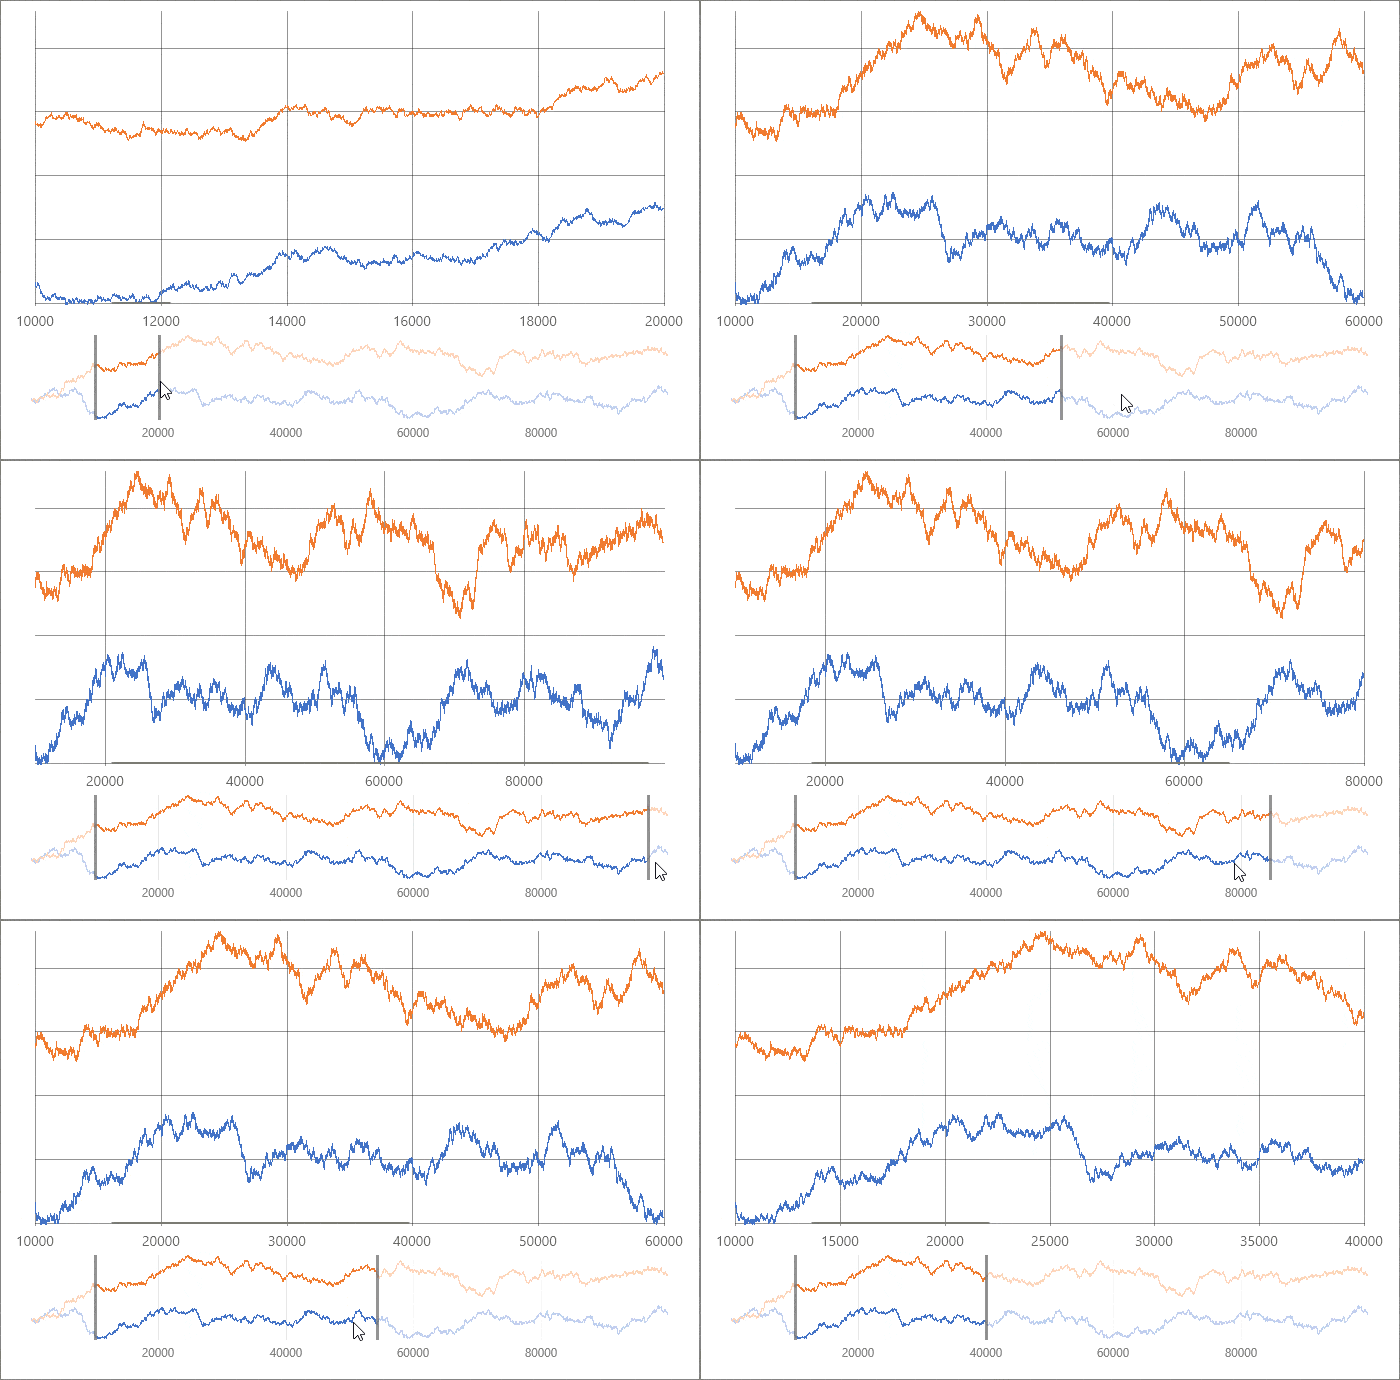
When a user selects a range within ChartRangeControlClient, this range is applied to the bound chart. The following image shows this behavior:

The example below uses the ChartRangeControlClient.Chart property to bind ChartRangeControlClient to a chart:
<Charts:CartesianChart x:Name="chart">
  <!--other settings-->
</Charts:CartesianChart>
<Controls:RangeControl Background="Transparent" ShowRangeThumbs="True" Margin="30,-10,30,15" MinHeight="75">
  <Charts:ChartRangeControlClient Chart="{Binding ElementName=chart}"/>
</Controls:RangeControl>
Inheritance
See Also