PieSeries Class
A pie series.
Namespace: DevExpress.WinUI.Charts
Assembly: DevExpress.WinUI.Charts.v22.1.dll
NuGet Package: DevExpress.WinUI
Declaration
Remarks
Assign a PieSeriesView object to the PieSeries.View property, and configure the object’s options to customize the view settings of the pie series.
Example
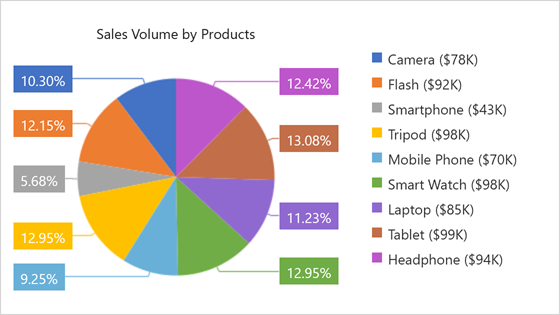
The following example demonstrates how to create a simple Pie Chart with one series.
<Window
    x:Class="PieChartSample.MainWindow"
    xmlns="http://schemas.microsoft.com/winfx/2006/xaml/presentation"
    xmlns:x="http://schemas.microsoft.com/winfx/2006/xaml"
    xmlns:local="using:PieChartSample"
    xmlns:d="http://schemas.microsoft.com/expression/blend/2008"
    xmlns:mc="http://schemas.openxmlformats.org/markup-compatibility/2006"
    xmlns:Charts="using:DevExpress.WinUI.Charts"
    mc:Ignorable="d">
    <Grid>
        <Grid.DataContext>
            <local:ChartViewModel/>
        </Grid.DataContext>
        <Charts:PieChart x:Name="chart" ToolTipEnabled="True">
            <Charts:PieChart.Legend>
                <Charts:Legend HorizontalPosition="RightOutside"
                               VerticalPosition="Center"
                               Orientation="Horizontal"
                               MaximumRowsOrColumns="1"/>
            </Charts:PieChart.Legend>
            <Charts:PieChart.Series>
                <Charts:PieSeries x:Name="series">
                    <Charts:PieSeries.View>
                        <Charts:PieSeriesView ToolTipPointPattern="{}{A}: {VP:p}"
                                              LegendPointPattern="{}{A} (${V}K)"
                                              ShowLabels="True"
                                              LabelPattern="{}{VP:p}"
                                              LabelPosition="TwoColumns">
                            <Charts:PieSeriesView.Title>
                                <TextBlock Text="Sales Volume by Products" Margin="10"/>
                            </Charts:PieSeriesView.Title>
                        </Charts:PieSeriesView>
                    </Charts:PieSeries.View>
                    <Charts:PieSeries.Data>
                        <Charts:DataSource PointSource="{Binding DataPoints}"
                                           ArgumentDataMember="Product"
                                           ArgumentScaleType="Qualitative"
                                           ValueDataMember="Income"
                                           ValueScaleType="Numerical"/>
                    </Charts:PieSeries.Data>
                </Charts:PieSeries>
            </Charts:PieChart.Series>
        </Charts:PieChart>
    </Grid>
</Window>
using DevExpress.Mvvm;
using Microsoft.UI.Xaml;
using System.Collections.Generic;

namespace PieChartSample {
    public sealed partial class MainWindow : Window {
        public MainWindow() {
            this.InitializeComponent();
        }
    }
    public class DataPoint {
        public string Product { get; set; }
        public double Income { get; set; }
    }
    public class ChartViewModel : ViewModelBase {
        public ChartViewModel() {
            List<DataPoint> dataPoints = new List<DataPoint> {
                new DataPoint() { Product = "Camera", Income = 78 },
                new DataPoint() { Product = "Flash", Income = 92 },
                new DataPoint() { Product = "Smartphone", Income = 43 },
                new DataPoint() { Product = "Tripod", Income = 98 },
                new DataPoint() { Product = "Mobile Phone", Income = 70 },
                new DataPoint() { Product = "Smart Watch", Income = 98 },
                new DataPoint() { Product = "Laptop", Income = 85 },
                new DataPoint() { Product = "Tablet", Income = 99 },
                new DataPoint() { Product = "Headphone", Income = 94 }
            };
            DataPoints = dataPoints;
        }
        public List<DataPoint> DataPoints { get; }
    }
}
For step-by-step instructions on how to create a Pie chart, refer to the following help topic: Lesson 2 - Create a Pie Chart.
Inheritance
Object
DependencyObject
UIElement
FrameworkElement
Panel
DevExpress.WinUI.Core.Internal.DXLogicalPanel
ChartPanel
SeriesBase
PieSeries
See Also