SeriesView.ToolTipPointTemplate Property
Specifies a template that is applied to series point tooltips. This is a dependency property.
Namespace: DevExpress.WinUI.Charts
Assembly: DevExpress.WinUI.Charts.v22.1.dll
NuGet Package: DevExpress.WinUI
Declaration
Property Value
| Type | Description |
|---|---|
| DataTemplate | A DataTemplate object. |
Example
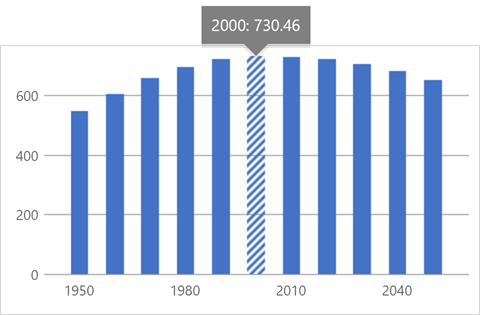
This example customizes the appearance and content of tooltips that are shown when a user clicks a bar.
<Page.Resources>
    <ResourceDictionary>
        <DataTemplate
        x:Key="toolTipTemplate">
            <Grid x:Name="Tooltip"
                    HorizontalAlignment="Center"
                    VerticalAlignment="Center"
                    UseLayoutRounding="True">
                <Grid x:Name="Shadow"
                        Margin="0,4,0,-4"
                        Opacity="0.1">
                    <Grid.RowDefinitions>
                        <RowDefinition Height="*" />
                        <RowDefinition Height="12" />
                    </Grid.RowDefinitions>
                    <Path x:Name="Arrow"
                            Stretch="Fill"
                            Fill="Black"
                            Data="F1 M 461,303L 474,316L 487,303L 461,303 Z "
                            HorizontalAlignment="Center"
                            Height="13"
                            Grid.Row="1"
                            Width="26"
                            Margin="0,-1,0,0" />
                    <Border x:Name="ContentBack"
                            Background="Black" />
                </Grid>
                <Grid>
                    <Grid.RowDefinitions>
                        <RowDefinition Height="*" />
                        <RowDefinition Height="12" />
                    </Grid.RowDefinitions>
                    <Path x:Name="Arrow1"
                            Stretch="Fill"
                            Fill="Gray"
                            Data="F1 M 461,303L 474,316L 487,303L 461,303 Z "
                            HorizontalAlignment="Center"
                            Height="13"
                            Grid.Row="1"
                            Width="26"
                            Margin="0,-1,0,0" />
                    <Border x:Name="ContentBack1"
                            Background="Gray" />
                    <TextBlock x:Name="Content1"
                                TextWrapping="Wrap"
                                Text="{Binding ToolTipText}"
                                Margin="10, 7.5, 10, 9"
                                FontSize="16"
                                Foreground="White" />
                </Grid>
            </Grid>
        </DataTemplate>
    </ResourceDictionary>
</Page.Resources>
<Grid>
    <Charts:CartesianChart ToolTipEnabled="True">
        <Charts:CartesianChart.Series>
            <Charts:Series>
                <Charts:Series.View>
                    <Charts:BarSeriesView
                                    ToolTipPointPattern="{}{A}:{V:f2}"
                                    ToolTipPointTemplate="{StaticResource toolTipTemplate}"/>
                </Charts:Series.View>
                <!-...-->
            </Charts:Series>
        </Charts:CartesianChart.Series>
    </Charts:CartesianChart>
</Grid>
See Also